## Venn Diagram: Set Theory Illustration
### Overview
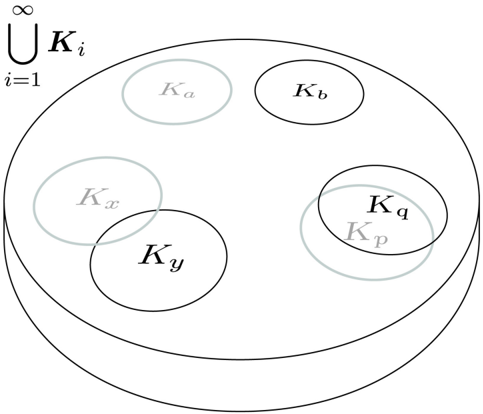
The image is a Venn diagram illustrating set theory concepts. It depicts a large circle representing a universal set, with several smaller circles inside representing subsets. Some subsets overlap, indicating intersections between them. The diagram also includes a union symbol and index notation, suggesting an infinite union of sets.
### Components/Axes
* **Universal Set:** Represented by the large circle.
* **Subsets:** Represented by smaller circles labeled as *K<sub>a</sub>*, *K<sub>b</sub>*, *K<sub>x</sub>*, *K<sub>y</sub>*, *K<sub>p</sub>*, and *K<sub>q</sub>*.
* **Union Notation:** At the top-left, the expression "∪<sub>i=1</sub><sup>∞</sup> *K<sub>i</sub>*" indicates the union of an infinite number of sets *K<sub>i</sub>*.
* **Overlapping Regions:** The overlapping areas between circles represent the intersection of the corresponding sets.
* **Color Coding:** Some circles are outlined in light gray, while others are outlined in black.
### Detailed Analysis or Content Details
* **Set Union:** The expression "∪<sub>i=1</sub><sup>∞</sup> *K<sub>i</sub>*" represents the union of an infinite number of sets *K<sub>i</sub>*, where *i* ranges from 1 to infinity.
* **Subset Labels:**
* *K<sub>a</sub>*: Located in the top-left quadrant, outlined in light gray.
* *K<sub>b</sub>*: Located in the top-right quadrant, outlined in black.
* *K<sub>x</sub>*: Located in the left quadrant, outlined in light gray.
* *K<sub>y</sub>*: Located in the bottom-left quadrant, outlined in black, and intersecting with *K<sub>x</sub>*.
* *K<sub>p</sub>*: Located in the bottom-right quadrant, outlined in light gray, and contained within *K<sub>q</sub>*.
* *K<sub>q</sub>*: Located in the bottom-right quadrant, outlined in black, and containing *K<sub>p</sub>*.
* **Spatial Relationships:**
* *K<sub>x</sub>* and *K<sub>y</sub>* intersect.
* *K<sub>p</sub>* is a subset of *K<sub>q</sub>*.
* *K<sub>a</sub>* and *K<sub>b</sub>* do not intersect with any other sets shown.
### Key Observations
* The diagram visually represents set relationships, including unions, intersections, and subsets.
* The use of light gray and black outlines may indicate different categories or properties of the sets.
* The infinite union notation suggests a broader context beyond the specific sets shown in the diagram.
### Interpretation
The Venn diagram illustrates fundamental concepts in set theory. The overlapping regions demonstrate the intersections between sets, while the containment of *K<sub>p</sub>* within *K<sub>q</sub>* shows a subset relationship. The infinite union notation implies that the diagram is part of a larger mathematical framework involving an infinite collection of sets. The different colors may represent different types of sets or relationships, but without further context, their specific meaning is unclear.