## Mathematical Diagram: Set Representation with Intersections
### Overview
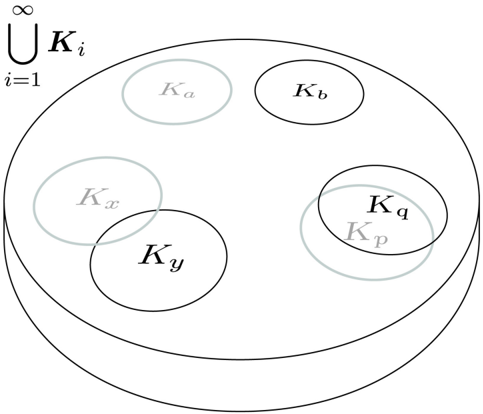
The image is a black-and-white mathematical diagram illustrating set relationships. It depicts a large universal set, represented by an outer circle, containing several smaller, labeled subsets. Some of these subsets are disjoint, while others intersect. The diagram uses visual conventions from set theory and Venn diagrams to represent concepts of union, inclusion, and intersection.
### Components/Axes
* **Primary Set Notation (Top-Left):** The symbol `⋃_{i=1}^{∞} K_i` is positioned in the top-left corner, outside the main circle. This denotes the union of an infinite series of sets labeled K, indexed from i=1 to infinity.
* **Universal Set:** A large, thin-lined circle forms the boundary for all other elements, representing the universal set or the union defined above.
* **Subsets:** Inside the large circle, there are six smaller circles, each labeled with a "K" and a subscript:
* `K_a` (Top-left quadrant, rendered in a lighter gray line)
* `K_b` (Top-right quadrant, rendered in a black line)
* `K_x` (Center-left, rendered in a lighter gray line)
* `K_y` (Center-left, below `K_x`, rendered in a black line)
* `K_p` (Center-right, rendered in a lighter gray line)
* `K_q` (Center-right, overlapping `K_p`, rendered in a black line)
* **Spatial Relationships:**
* `K_x` and `K_y` overlap, creating an intersection region.
* `K_p` and `K_q` overlap, creating an intersection region.
* `K_a`, `K_b`, the `K_x/K_y` pair, and the `K_p/K_q` pair are all disjoint from each other (no overlaps between these groups).
### Detailed Analysis
The diagram is purely conceptual and does not contain numerical data, axes, or quantitative scales. Its information is encoded in the topology and labeling of the sets.
* **Set Labels:** All sets are variants of a base label "K". The subscripts (a, b, x, y, p, q) are arbitrary identifiers.
* **Line Color/Style:** Two distinct line styles are used:
* **Black Lines:** Used for the universal set boundary and for subsets `K_b`, `K_y`, and `K_q`.
* **Light Gray Lines:** Used for subsets `K_a`, `K_x`, and `K_p`.
This color differentiation may imply a categorical grouping (e.g., two different types or classes of sets) or may simply be for visual clarity to distinguish overlapping pairs.
* **Intersection Visualization:** The diagram explicitly shows two pairwise intersections:
1. The intersection of `K_x` and `K_y` (denoted mathematically as `K_x ∩ K_y`).
2. The intersection of `K_p` and `K_q` (denoted as `K_p ∩ K_q`).
### Key Observations
1. **Non-Exhaustive Representation:** The label `⋃_{i=1}^{∞} K_i` implies an infinite collection of sets, but only six are drawn. The diagram is therefore a schematic, not a complete, literal representation.
2. **Selective Intersection:** Only specific pairs of sets are shown to intersect (`K_x` with `K_y`, `K_p` with `K_q`). All other sets (`K_a`, `K_b`) are depicted as disjoint from all others and from the intersecting pairs.
3. **Visual Grouping by Color:** The use of gray lines for `K_a`, `K_x`, `K_p` and black lines for `K_b`, `K_y`, `K_q` creates a visual pattern. Notably, within each intersecting pair (`K_x/K_y` and `K_p/K_q`), one set is gray and the other is black.
### Interpretation
This diagram is a pedagogical or illustrative tool used in fields like set theory, logic, or computer science (e.g., database theory, formal languages). It visually communicates several abstract concepts:
* **Union and Containment:** The outer circle and the `⋃` symbol establish that all shown sets (`K_a` through `K_q`) are elements of a larger, infinite union.
* **Intersection:** The overlapping circles for (`K_x`, `K_y`) and (`K_p`, `K_q`) demonstrate that these specific sets share common elements. The diagram does not specify the nature or size of these intersections.
* **Disjointness:** The separation of `K_a` and `K_b` from all other sets indicates they share no elements with the other depicted sets.
* **Potential Categorization:** The consistent color pairing within intersecting sets (one gray, one black) might suggest a deeper relationship. For example, it could illustrate that an intersection occurs between sets of two different "types" (Type A = gray, Type B = black). Alternatively, it could simply be a design choice to make the overlapping regions easier to see.
**In summary, the image provides a qualitative, relational map of a subset of an infinite collection of sets. It emphasizes which sets are disjoint and which have pairwise intersections, using spatial positioning and line color to convey structure without providing any quantitative or instance-level data.**