## Chart: Cross Section vs. Center-of-Mass Energy
### Overview
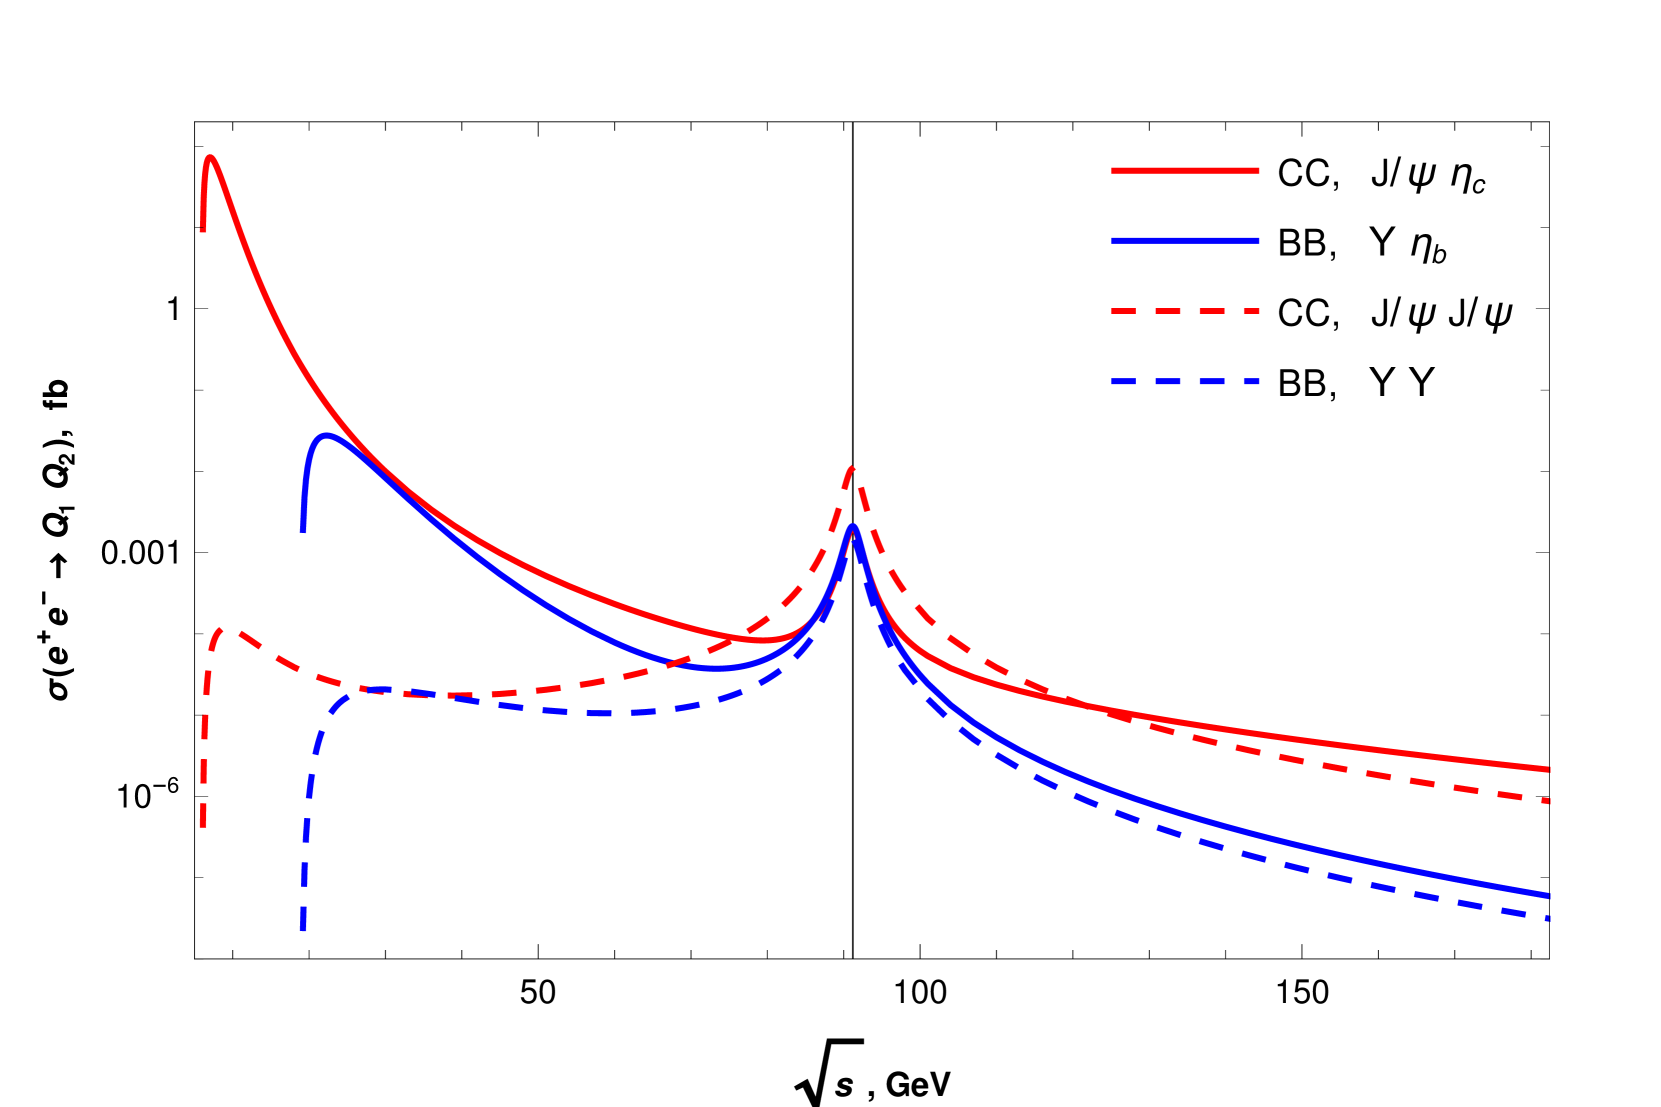
The image is a plot showing the cross section (sigma) of electron-positron annihilation into various final states as a function of the center-of-mass energy (sqrt(s)). The plot includes four different data series, each representing a different final state. The y-axis is on a logarithmic scale.
### Components/Axes
* **Title:** There is no explicit title on the chart.
* **X-axis:**
* Label: "√s, GeV" (Center-of-mass energy in GeV)
* Scale: Linear, ranging from approximately 0 to 150 GeV.
* Ticks: Present at approximately 50, 100, and 150 GeV.
* **Y-axis:**
* Label: "σ(e+e- → Q1 Q2), fb" (Cross section in femtobarns)
* Scale: Logarithmic.
* Ticks: Present at approximately 1, 0.001, and 10^-6.
* **Legend:** Located in the top-right corner.
* Red solid line: "CC, J/ψ ηc"
* Blue solid line: "BB, Υ ηb"
* Red dashed line: "CC, J/ψ J/ψ"
* Blue dashed line: "BB, Υ Υ"
* **Vertical Line:** A vertical line is present at approximately 95-100 GeV.
### Detailed Analysis
* **Red Solid Line (CC, J/ψ ηc):**
* Trend: Starts high on the left, decreases rapidly, then flattens out. Shows a peak around 95-100 GeV.
* Approximate values:
* At x=20 GeV, y ≈ 2 fb
* At x=50 GeV, y ≈ 0.005 fb
* Peak at x=95-100 GeV, y ≈ 0.0015 fb
* At x=150 GeV, y ≈ 1e-6 fb
* **Blue Solid Line (BB, Υ ηb):**
* Trend: Starts at a lower value than the red solid line, increases to a peak around x=40 GeV, then decreases and flattens out. Shows a peak around 95-100 GeV.
* Approximate values:
* At x=20 GeV, y ≈ 0.0002 fb
* Peak at x=40 GeV, y ≈ 0.004 fb
* At x=50 GeV, y ≈ 0.002 fb
* Peak at x=95-100 GeV, y ≈ 0.001 fb
* At x=150 GeV, y ≈ 2e-7 fb
* **Red Dashed Line (CC, J/ψ J/ψ):**
* Trend: Starts low, increases rapidly, then flattens out. Shows a peak around 95-100 GeV.
* Approximate values:
* At x=20 GeV, y ≈ 2e-7 fb
* At x=50 GeV, y ≈ 5e-7 fb
* Peak at x=95-100 GeV, y ≈ 0.0005 fb
* At x=150 GeV, y ≈ 2e-7 fb
* **Blue Dashed Line (BB, Υ Υ):**
* Trend: Starts very low, increases rapidly, then flattens out. Shows a peak around 95-100 GeV.
* Approximate values:
* At x=20 GeV, y ≈ 1e-7 fb
* At x=50 GeV, y ≈ 2e-7 fb
* Peak at x=95-100 GeV, y ≈ 0.0002 fb
* At x=150 GeV, y ≈ 5e-8 fb
### Key Observations
* All four data series show a peak in the cross section around the same center-of-mass energy (95-100 GeV).
* The solid lines (CC, J/ψ ηc and BB, Υ ηb) have higher cross sections at lower center-of-mass energies compared to the dashed lines (CC, J/ψ J/ψ and BB, Υ Υ).
* The red solid line (CC, J/ψ ηc) has the highest cross section at low energies.
* The blue dashed line (BB, Υ Υ) has the lowest cross section across the entire range.
### Interpretation
The plot likely represents the cross sections for different decay channels of a resonance particle with a mass around 95-100 GeV. The peaks in the cross sections indicate that the electron-positron annihilation is resonantly enhanced when the center-of-mass energy matches the mass of the resonance. The different final states (J/ψ ηc, Υ ηb, J/ψ J/ψ, Υ Υ) represent different decay modes of this resonance. The differences in the cross sections for different decay modes reflect the different coupling strengths of the resonance to these final states. The vertical line at approximately 95-100 GeV likely indicates the mass of a known particle, possibly the Z boson.