## Line Graph: Cross-Section for e⁺e⁻ → Q₁Q₂ as a Function of √s (GeV)
### Overview
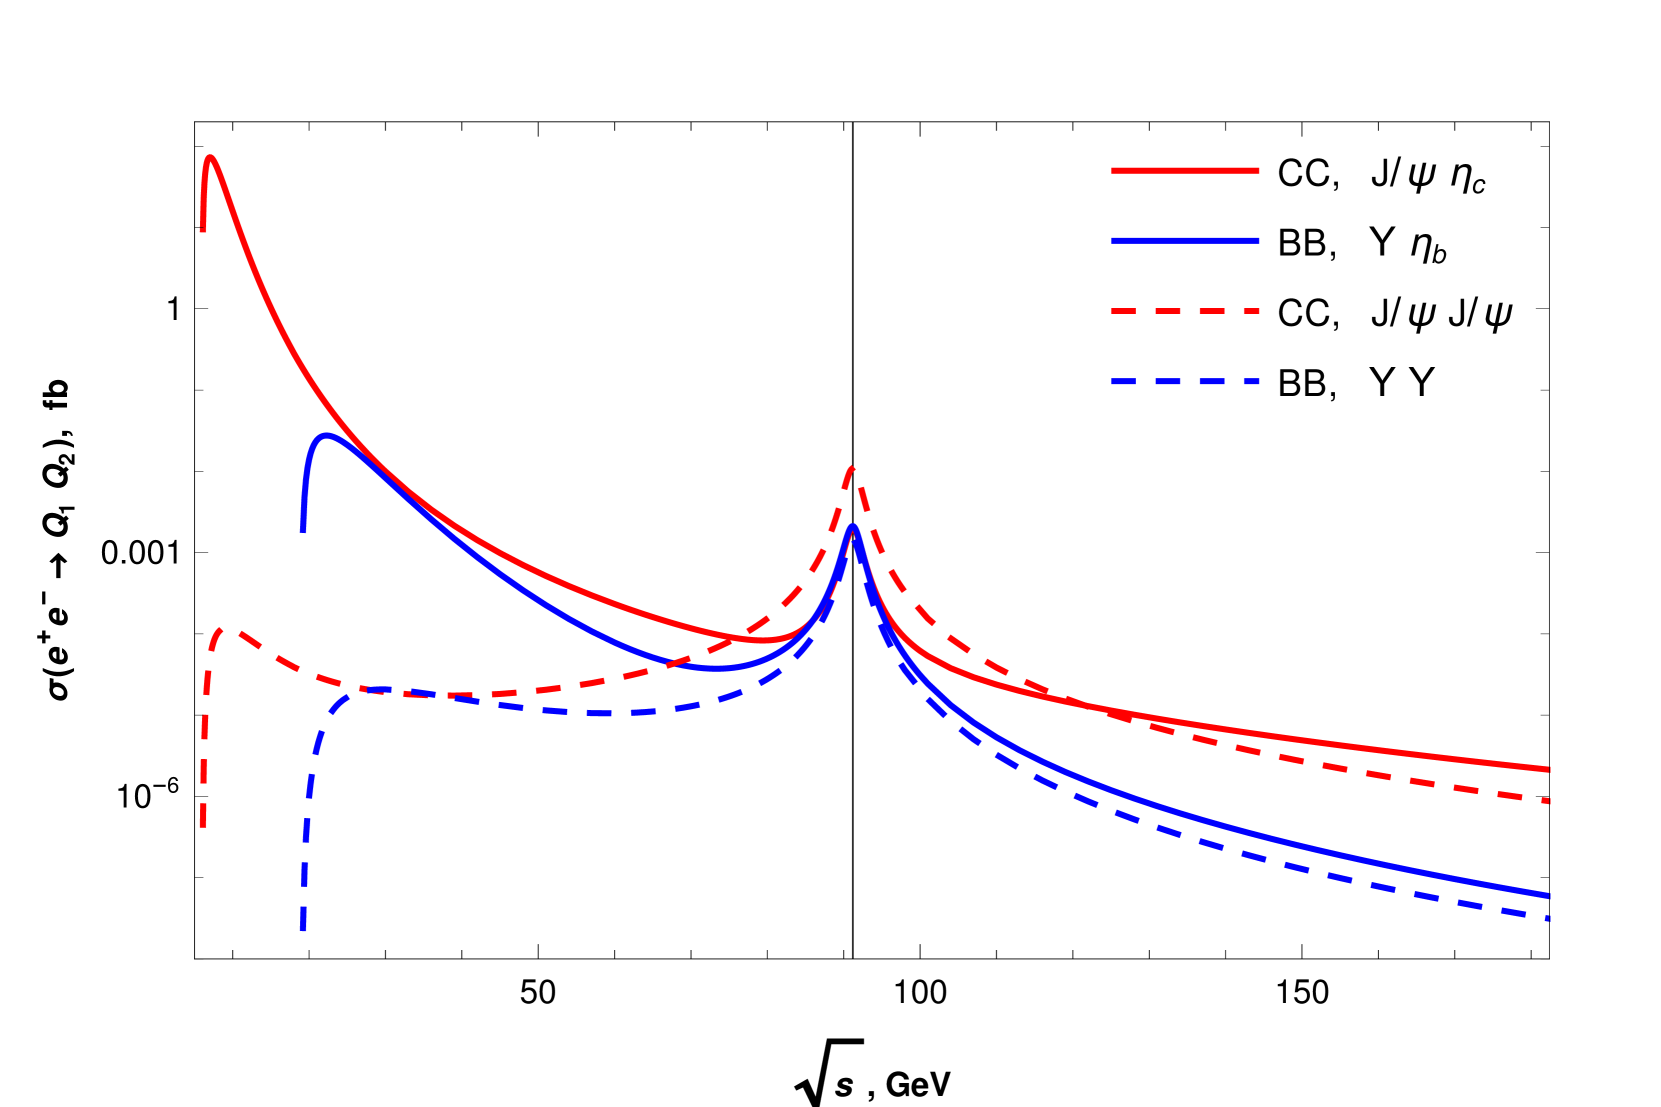
The graph depicts the cross-section (σ) for electron-positron annihilation into quark pairs (Q₁Q₂) as a function of the center-of-mass energy (√s, in GeV). Four theoretical predictions are plotted, differentiated by coupling mechanisms (CC for charm quarks, BB for bottom quarks) and interaction terms (single vs. double couplings). The y-axis uses a logarithmic scale (10⁻⁶ to 1 fb), while the x-axis spans 0–150 GeV.
---
### Components/Axes
- **X-axis**: √s (GeV), labeled with approximate markers at 0, 50, 100, and 150 GeV.
- **Y-axis**: σ(e⁺e⁻ → Q₁Q₂) in femtobarns (fb), logarithmic scale from 10⁻⁶ to 1 fb.
- **Legend**: Located in the top-right corner, with four entries:
- Solid red: CC, J/ψ η_c
- Solid blue: BB, Y η_b
- Dashed red: CC, J/ψ J/ψ
- Dashed blue: BB, Y Y
---
### Detailed Analysis
1. **Solid Red Line (CC, J/ψ η_c)**:
- **Trend**: Peaks sharply near √s ≈ 100 GeV (~1 fb), then declines steeply. At 0 GeV, σ ≈ 1 fb; at 150 GeV, σ ≈ 10⁻⁴ fb.
- **Key Points**:
- √s = 0 GeV: σ ≈ 1 fb
- √s = 100 GeV: σ ≈ 1 fb
- √s = 150 GeV: σ ≈ 10⁻⁴ fb
2. **Solid Blue Line (BB, Y η_b)**:
- **Trend**: Peaks at √s ≈ 100 GeV (~0.01 fb), lower than the red line. Declines gradually to ~10⁻⁵ fb at 150 GeV.
- **Key Points**:
- √s = 0 GeV: σ ≈ 10⁻³ fb
- √s = 100 GeV: σ ≈ 0.01 fb
- √s = 150 GeV: σ ≈ 10⁻⁵ fb
3. **Dashed Red Line (CC, J/ψ J/ψ)**:
- **Trend**: Peaks at √s ≈ 100 GeV (~0.001 fb), significantly lower than the solid red line. Declines to ~10⁻⁶ fb at 150 GeV.
- **Key Points**:
- √s = 0 GeV: σ ≈ 10⁻⁴ fb
- √s = 100 GeV: σ ≈ 0.001 fb
- √s = 150 GeV: σ ≈ 10⁻⁶ fb
4. **Dashed Blue Line (BB, Y Y)**:
- **Trend**: Peaks at √s ≈ 100 GeV (~0.0001 fb), the lowest among all lines. Declines to ~10⁻⁷ fb at 150 GeV.
- **Key Points**:
- √s = 0 GeV: σ ≈ 10⁻⁵ fb
- √s = 100 GeV: σ ≈ 0.0001 fb
- √s = 150 GeV: σ ≈ 10⁻⁷ fb
---
### Key Observations
- **Peak Resonance**: All lines peak near √s ≈ 100 GeV, suggesting a resonance or threshold effect at this energy.
- **Coupling Strength**:
- CC processes (red lines) exhibit higher cross-sections than BB (blue lines) for equivalent couplings.
- Double couplings (J/ψ J/ψ, Y Y) reduce cross-sections by 1–2 orders of magnitude compared to single couplings (J/ψ η_c, Y η_b).
- **Asymptotic Behavior**: All lines decay monotonically at √s > 100 GeV, with no secondary peaks observed.
---
### Interpretation
The data suggests that the cross-section for e⁺e⁻ → Q₁Q₂ is strongly dependent on both the center-of-mass energy and the quark coupling mechanism. The resonance at √s ≈ 100 GeV likely corresponds to a hypothetical or known particle (e.g., Z boson or a quarkonium state), with the peak magnitude reflecting the strength of the interaction. The suppression of double-coupling processes (dashed lines) implies that single couplings dominate the interaction dynamics. The disparity between CC and BB cross-sections may indicate differences in quark mass effects or decay channel availability. This graph could inform high-energy physics models by highlighting dominant interaction pathways at specific energy scales.