## Scatter Plot: Confidence vs. Target Length in High School Computer Science
### Overview
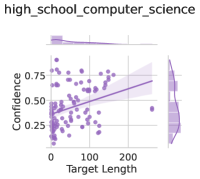
The image is a scatter plot showing the relationship between "Confidence" and "Target Length" in the context of high school computer science. The plot includes marginal distributions (histograms) for both variables along the axes. The scatter plot shows individual data points and a regression line with a confidence interval.
### Components/Axes
* **Title:** high\_school\_computer\_science
* **X-axis:** Target Length
* Scale ranges from 0 to approximately 250.
* **Y-axis:** Confidence
* Scale ranges from 0 to 0.75.
* **Data Points:** Each point represents a data entry.
* **Regression Line:** A line indicating the general trend of the data.
* **Confidence Interval:** Shaded area around the regression line, indicating the uncertainty in the line's position.
* **Marginal Distributions:** Histograms along the x and y axes showing the distribution of each variable.
### Detailed Analysis
* **Target Length:**
* The majority of data points are clustered between 0 and 100.
* There are fewer data points as the target length increases beyond 100.
* The marginal distribution shows a peak near 0, indicating many short target lengths.
* **Confidence:**
* Confidence values are spread between 0 and 0.75.
* The marginal distribution shows a peak around 0.25-0.5.
* **Trend:**
* The regression line slopes slightly upward, suggesting a positive correlation between target length and confidence.
* The confidence interval widens as target length increases, indicating greater uncertainty for longer target lengths.
### Key Observations
* There is a weak positive correlation between target length and confidence.
* Most data points have a target length less than 100.
* Confidence values are generally between 0.25 and 0.75.
### Interpretation
The scatter plot suggests that, in the context of high school computer science, there is a slight tendency for confidence to increase with target length. However, the correlation is weak, and there is considerable variability in confidence for any given target length. The widening confidence interval for longer target lengths suggests that the relationship between target length and confidence becomes less certain as target length increases. The clustering of data points at lower target lengths indicates that shorter targets are more common in the dataset.