## Scatter Plot: High School Computer Science Confidence vs. Target Length
### Overview
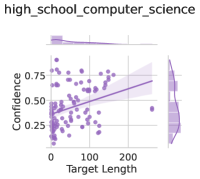
The image is a scatter plot titled "high_school_computer_science" showing the relationship between "Target Length" (x-axis) and "Confidence" (y-axis). A linear trend line with a shaded confidence interval is overlaid on the data points. Box plots are embedded in the top and right margins to show distributions of the variables.
---
### Components/Axes
- **Title**: "high_school_computer_science" (top-left, bold text).
- **X-axis**:
- Label: "Target Length" (bottom, horizontal).
- Scale: 0 to 200 (linear, with ticks at 0, 100, 200).
- **Y-axis**:
- Label: "Confidence" (left, vertical).
- Scale: 0.25 to 0.75 (linear, with ticks at 0.25, 0.50, 0.75).
- **Legend**: No explicit legend, but the trend line and shaded area are visually distinct.
- **Box Plots**:
- **Top-left**: Horizontal box plot for "Target Length" (median ~100, range 0–200).
- **Top-right**: Vertical box plot for "Confidence" (median ~0.5, range 0.3–0.7).
---
### Detailed Analysis
- **Scatter Plot**:
- **Data Points**: Purple dots distributed across the plot. Most points cluster between x=50–150 and y=0.4–0.6.
- **Trend Line**: A solid purple line slopes upward from ~0.3 at x=0 to ~0.75 at x=200. The line equation appears linear (y = mx + b, with m > 0).
- **Shaded Area**: A light purple band around the trend line, likely representing a 95% confidence interval (uncertainty range).
- **Box Plots**:
- **Target Length (Top-left)**:
- Median: ~100.
- Interquartile Range (IQR): ~50–150.
- Whiskers: Extend to 0 and 200 (outliers not visible).
- **Confidence (Top-right)**:
- Median: ~0.5.
- IQR: ~0.4–0.6.
- Whiskers: Extend to 0.3 and 0.7 (outliers not visible).
---
### Key Observations
1. **Positive Correlation**: The trend line indicates a strong positive relationship between target length and confidence. As target length increases, confidence rises.
2. **Variability**: The shaded confidence interval widens at lower target lengths (x < 50), suggesting greater uncertainty in predictions for shorter lengths.
3. **Distribution**:
- Target lengths are evenly distributed across the full range (0–200).
- Confidence values are concentrated around 0.5, with fewer extreme values (e.g., <0.3 or >0.7).
---
### Interpretation
The data suggests that **longer target lengths in high school computer science projects are associated with higher confidence levels**. This could reflect factors like increased data availability, more time for validation, or better resource allocation for larger projects. The shaded confidence interval highlights that while the trend is clear, individual results vary, emphasizing the need for context-specific analysis. The box plots confirm that both variables exhibit moderate spread, with no extreme outliers. The absence of data points at x=0 or y=0.25 implies that the dataset may exclude edge cases or focus on mid-range values.