## Diagram: Causal Inference Example
### Overview
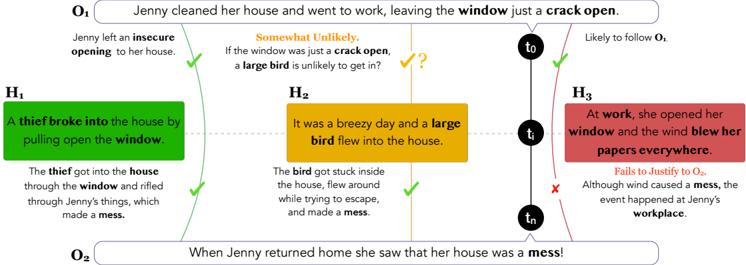
The image presents a diagram illustrating causal inference with three hypotheses (H1, H2, H3) attempting to explain an observation (O2) given an initial state (O1). The diagram uses text boxes, curved arrows, and time points to represent events and their relationships.
### Components/Axes
* **O1 (Top):** Initial observation: "Jenny cleaned her house and went to work, leaving the window just a crack open."
* Supporting statement: "Jenny left an insecure opening to her house."
* **H1 (Left, Green):** Hypothesis 1: "A thief broke into the house by pulling open the window."
* Supporting statement: "The thief got into the house through the window and rifled through Jenny's things, which made a mess."
* **H2 (Center, Yellow):** Hypothesis 2: "It was a breezy day and a large bird flew into the house."
* Supporting statement: "The bird got stuck inside the house, flew around while trying to escape, and made a mess."
* "Somewhat Unlikely. If the window was just a crack open, a large bird is unlikely to get in?"
* **H3 (Right, Red):** Hypothesis 3: "At work, she opened her window and the wind blew her papers everywhere."
* Supporting statement: "Fails to Justify to O2. Although wind caused a mess, the event happened at Jenny's workplace."
* **O2 (Bottom):** Final observation: "When Jenny returned home she saw that her house was a mess!"
* **Time Points:** t0 (top), ti (middle), tn (bottom) connected by a vertical line.
* **Arrows:** Curved arrows connect O1 to H1, H2, and H3, and H1, H2, and H3 to O2.
* **Checkmarks:** Green checkmarks indicate support for the hypotheses. A red "X" indicates a failure to justify. A yellow question mark indicates uncertainty.
### Detailed Analysis
* **O1 to H1:** A curved arrow connects O1 to H1 with a green checkmark, indicating that the initial observation supports the hypothesis of a thief breaking in.
* **H1 to O2:** A curved arrow connects H1 to O2 with a green checkmark, indicating that the hypothesis of a thief breaking in explains the final observation of the house being a mess.
* **O1 to H2:** A curved arrow connects O1 to H2 with a yellow question mark, indicating uncertainty about whether the initial observation supports the hypothesis of a bird flying in.
* **H2 to O2:** A curved arrow connects H2 to O2 with a green checkmark, indicating that the hypothesis of a bird flying in explains the final observation of the house being a mess.
* **O1 to H3:** A curved arrow connects O1 to H3 with a green checkmark, indicating that the initial observation supports the hypothesis of Jenny opening her window at work.
* **H3 to O2:** A curved arrow connects H3 to O2 with a red "X", indicating that the hypothesis of Jenny opening her window at work does not explain the final observation of the house being a mess.
* **Time Line:**
* t0: Initial time point, likely to follow O1.
* ti: Intermediate time point.
* tn: Final time point.
### Key Observations
* Hypothesis 1 (thief) and Hypothesis 2 (bird) are both supported by the initial and final observations.
* Hypothesis 3 (wind at work) is not supported as an explanation for the house being a mess.
* There is uncertainty about whether the initial observation (window a crack open) makes it likely that a bird flew in.
### Interpretation
The diagram illustrates a scenario where multiple hypotheses are considered to explain an observation. It demonstrates how initial conditions and intermediate events can support or refute different explanations. The diagram highlights the importance of considering alternative explanations and evaluating their plausibility based on available evidence. The use of checkmarks and an "X" visually represents the degree to which each hypothesis is supported by the evidence. The uncertainty regarding the bird hypothesis suggests the need for further investigation or evidence to determine its validity.