## Line Graphs: BFCL V3 - Train Reward vs. Eval Reward
### Overview
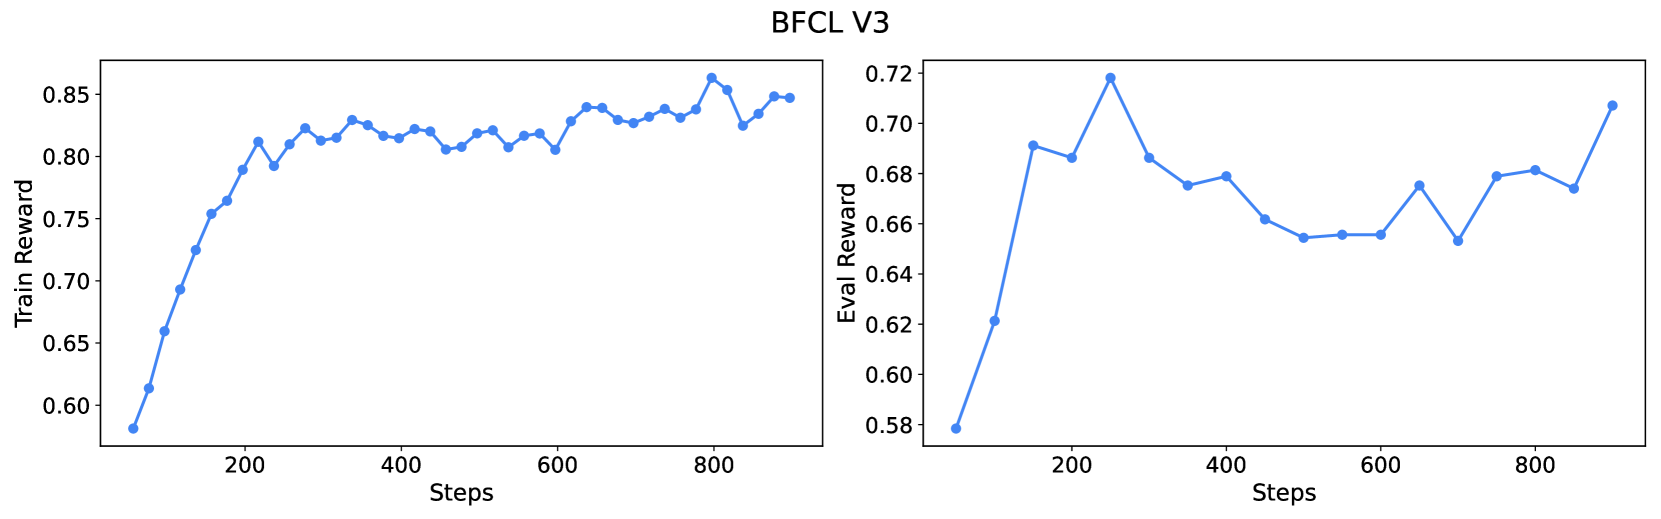
The image presents two line graphs side-by-side, both titled "BFCL V3". The left graph displays "Train Reward" against "Steps," while the right graph shows "Eval Reward" against "Steps." Both graphs use the same x-axis scale ("Steps") and have a blue line representing the data.
### Components/Axes
**Left Graph (Train Reward):**
* **Title:** BFCL V3
* **Y-axis:** "Train Reward," ranging from 0.60 to 0.85 in increments of 0.05.
* **X-axis:** "Steps," ranging from 0 to 800 in increments of 200.
* **Data Series:** A single blue line representing the train reward.
**Right Graph (Eval Reward):**
* **Title:** BFCL V3
* **Y-axis:** "Eval Reward," ranging from 0.58 to 0.72 in increments of 0.02.
* **X-axis:** "Steps," ranging from 0 to 800 in increments of 200.
* **Data Series:** A single blue line representing the eval reward.
### Detailed Analysis
**Left Graph (Train Reward):**
* **Trend:** The blue line initially slopes sharply upward, then plateaus and fluctuates slightly around a value.
* **Data Points:**
* At 0 Steps: Approximately 0.58
* At 200 Steps: Approximately 0.80
* At 400 Steps: Approximately 0.82
* At 600 Steps: Approximately 0.82
* At 800 Steps: Approximately 0.84
**Right Graph (Eval Reward):**
* **Trend:** The blue line initially slopes sharply upward, then decreases, fluctuates, and finally increases again.
* **Data Points:**
* At 0 Steps: Approximately 0.58
* At 200 Steps: Approximately 0.72
* At 400 Steps: Approximately 0.68
* At 600 Steps: Approximately 0.66
* At 800 Steps: Approximately 0.68
### Key Observations
* The "Train Reward" graph shows a rapid initial increase in reward, followed by a plateau with minor fluctuations.
* The "Eval Reward" graph shows an initial increase, followed by a decrease and subsequent fluctuations, indicating more variability in the evaluation reward.
### Interpretation
The graphs illustrate the training and evaluation performance of an algorithm (BFCL V3) over a number of steps. The "Train Reward" graph suggests that the algorithm quickly learns and reaches a stable performance level. The "Eval Reward" graph indicates that while the algorithm initially improves in evaluation, its performance fluctuates more, suggesting that the algorithm's generalization ability might be less stable than its training performance. The fluctuations in the "Eval Reward" could be due to overfitting or other factors affecting the algorithm's ability to perform well on unseen data.