\n
## Line Chart: BFCL V3 Training and Evaluation Reward
### Overview
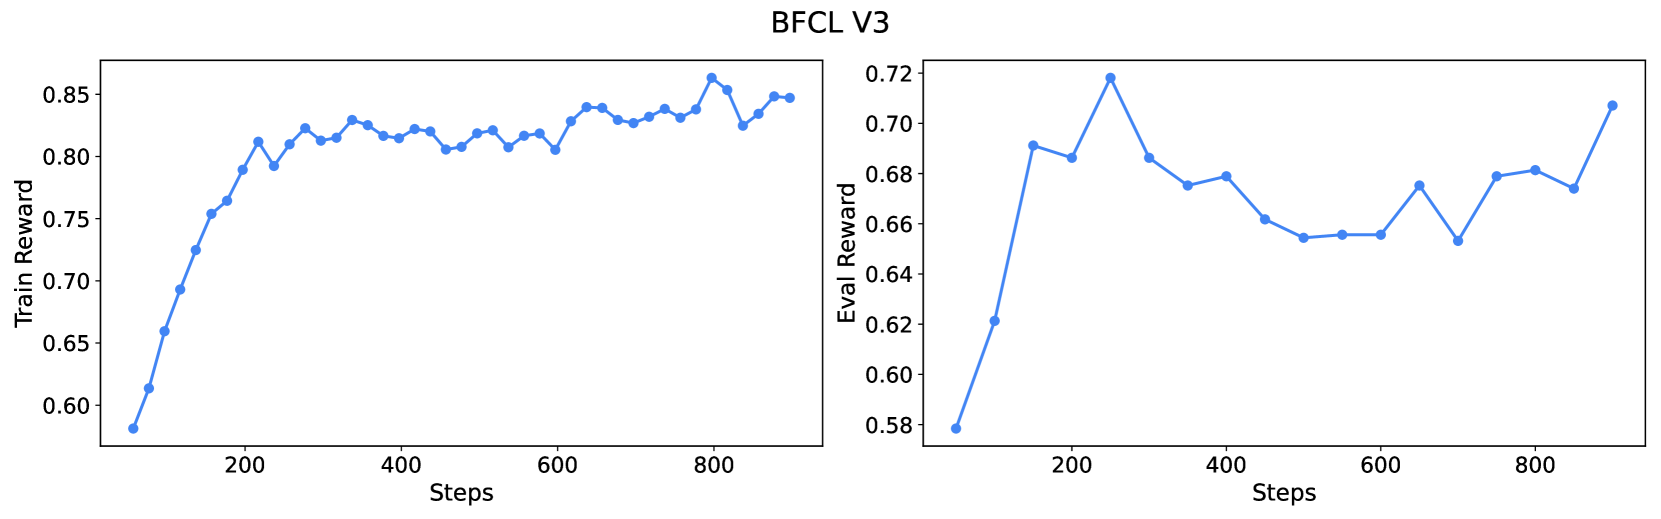
The image presents two line charts side-by-side, both depicting reward values over training steps. The left chart shows the "Train Reward" and the right chart shows the "Eval Reward". Both charts share the same x-axis, representing "Steps", and have different y-axis scales representing reward values. The title "BFCL V3" is centered above both charts.
### Components/Axes
* **Title:** BFCL V3 (centered at the top)
* **Left Chart:**
* **X-axis Label:** Steps (ranging from approximately 0 to 900)
* **Y-axis Label:** Train Reward (ranging from approximately 0.60 to 0.86)
* **Data Series:** A single blue line representing the training reward.
* **Right Chart:**
* **X-axis Label:** Steps (ranging from approximately 0 to 900)
* **Y-axis Label:** Eval Reward (ranging from approximately 0.58 to 0.72)
* **Data Series:** A single blue line representing the evaluation reward.
### Detailed Analysis
**Left Chart (Train Reward):**
The blue line representing the Train Reward starts at approximately 0.60 at Step 0. It exhibits a steep upward trend until approximately Step 200, reaching a value of around 0.78. From Step 200 to Step 600, the line fluctuates around a mean of approximately 0.81, with oscillations between roughly 0.79 and 0.83. From Step 600 to Step 900, the line shows a slight upward trend, ending at approximately 0.85.
**Right Chart (Eval Reward):**
The blue line representing the Eval Reward starts at approximately 0.72 at Step 0. It decreases to a minimum of around 0.68 at Step 150. From Step 150 to Step 400, the line fluctuates, decreasing to approximately 0.67 at Step 400. From Step 400 to Step 700, the line fluctuates around a mean of approximately 0.68, with oscillations between roughly 0.66 and 0.70. From Step 700 to Step 900, the line shows a clear upward trend, ending at approximately 0.71.
### Key Observations
* The Train Reward consistently remains higher than the Eval Reward throughout the entire training process.
* The Train Reward exhibits a more stable trend after Step 200, while the Eval Reward shows more pronounced fluctuations.
* Both charts show an overall increasing trend in reward values as the number of steps increases, suggesting that the model is learning.
* The Eval Reward shows a dip in performance around Step 150-400, which could indicate a period of instability or overfitting.
### Interpretation
The charts demonstrate the training progress of the BFCL V3 model. The increasing Train Reward indicates that the model is successfully learning to maximize its reward on the training data. The Eval Reward, while lower than the Train Reward (as expected due to generalization), also shows an increasing trend, suggesting that the model is generalizing well to unseen data. The initial dip in Eval Reward could be due to the model initially overfitting to the training data, but it recovers as training continues. The divergence between Train and Eval Reward is a common phenomenon in machine learning, indicating the gap between performance on seen and unseen data. The overall positive trends in both charts suggest that the BFCL V3 model is effectively learning and improving its performance over time.