## Line Charts: BFCL V3 Training and Evaluation Rewards
### Overview
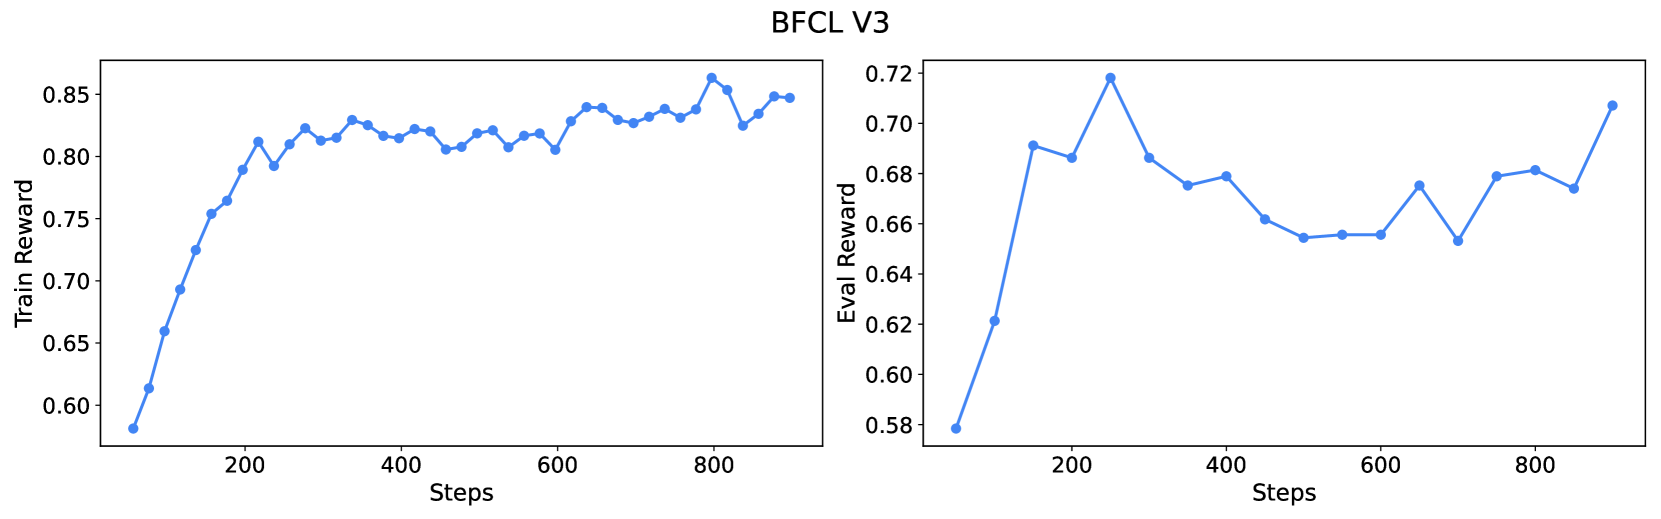
The image displays two side-by-side line charts under the main title "BFCL V3". The charts plot reward metrics against training steps. The left chart shows the "Train Reward" over steps, and the right chart shows the "Eval Reward" over steps. Both charts use a blue line with circular markers to represent a single data series each.
### Components/Axes
* **Main Title:** "BFCL V3" (centered at the top).
* **Left Chart:**
* **Y-axis Label:** "Train Reward"
* **Y-axis Scale:** Ranges from approximately 0.60 to 0.85, with major ticks at 0.60, 0.65, 0.70, 0.75, 0.80, 0.85.
* **X-axis Label:** "Steps"
* **X-axis Scale:** Ranges from 0 to 800, with major ticks at 200, 400, 600, 800.
* **Right Chart:**
* **Y-axis Label:** "Eval Reward"
* **Y-axis Scale:** Ranges from approximately 0.58 to 0.72, with major ticks at 0.58, 0.60, 0.62, 0.64, 0.66, 0.68, 0.70, 0.72.
* **X-axis Label:** "Steps"
* **X-axis Scale:** Ranges from 0 to 800, with major ticks at 200, 400, 600, 800.
* **Data Series:** Both charts contain a single data series represented by a solid blue line with circular markers. There is no separate legend, as each chart's y-axis label defines the series.
### Detailed Analysis
**Left Chart - Train Reward:**
* **Trend:** The line shows a steep, consistent upward slope from the start until approximately step 200, after which the rate of increase slows significantly. From step 200 to 800, the trend is generally upward but with noticeable fluctuations, forming a plateau-like region with a slight positive drift.
* **Key Data Points (Approximate):**
* Step 0: ~0.58
* Step 100: ~0.75
* Step 200: ~0.81
* Step 400: ~0.82
* Step 600: ~0.81
* Step 800: ~0.85 (appears to be the global maximum)
* Final Point (~Step 900): ~0.85
**Right Chart - Eval Reward:**
* **Trend:** The line rises sharply from the start to a peak around step 250. Following this peak, there is a general downward trend with fluctuations until approximately step 700, after which the trend reverses and begins to climb again.
* **Key Data Points (Approximate):**
* Step 0: ~0.58
* Step 100: ~0.69
* Step 250 (Peak): ~0.72
* Step 400: ~0.68
* Step 600: ~0.655
* Step 700 (Local Minimum): ~0.65
* Step 800: ~0.68
* Final Point (~Step 900): ~0.71
### Key Observations
1. **Divergent Post-Peak Behavior:** While the training reward continues a slow, fluctuating ascent after step 200, the evaluation reward peaks early (step ~250) and then enters a prolonged period of decline and volatility before recovering in the final steps.
2. **Scale Difference:** The training reward reaches a higher absolute value (max ~0.85) compared to the evaluation reward (max ~0.72), indicating a performance gap between training and evaluation conditions.
3. **Volatility:** The evaluation reward curve exhibits more pronounced peaks and valleys relative to its scale than the training reward curve after the initial rise.
4. **Final Recovery:** Both metrics show an upward trend in the final ~100 steps plotted, with the evaluation reward showing a particularly sharp increase from its local minimum at step 700.
### Interpretation
The charts likely depict the learning progress of a machine learning model (possibly a reinforcement learning agent, given the "Reward" metric) on a task or benchmark named "BFCL V3".
* **Learning Dynamics:** The model rapidly learns the training task, as shown by the steep initial rise in Train Reward. The subsequent plateau suggests it is approaching the limit of its performance on the training distribution.
* **Generalization Gap:** The significant and persistent gap between Train Reward and Eval Reward, along with the Eval Reward's decline after an early peak, strongly suggests **overfitting**. The model's performance on the unseen evaluation data deteriorates even as it continues to optimize for the training data.
* **Potential Causes:** The volatility and decline in Eval Reward could be due to the model memorizing noise or specific patterns in the training set that do not generalize. The late recovery in Eval Reward might indicate the model is beginning to learn more robust features, or it could be a random fluctuation.
* **Investigative Insight:** A practitioner viewing this would prioritize investigating the cause of the generalization gap. Actions might include adjusting regularization, increasing training data diversity, modifying the model architecture, or implementing early stopping based on the evaluation metric (which would have been optimal around step 250 in this run). The "BFCL" acronym likely refers to the specific benchmark or task being evaluated.