## Line Chart: Accuracy vs. Step for RLVR and RLME
### Overview
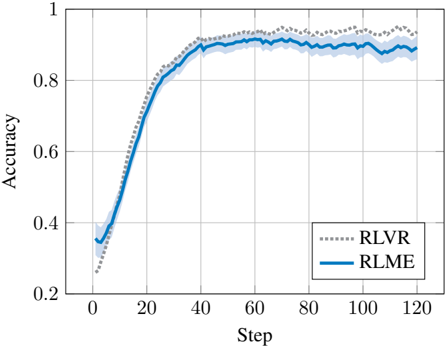
This image displays a line chart comparing the performance (Accuracy) of two distinct methods, labeled "RLVR" and "RLME," over a training duration of 120 steps. The chart illustrates the learning progression of both models, showing a rapid increase in accuracy followed by a plateau.
### Components/Axes
* **Y-Axis:** Labeled "Accuracy." The scale ranges from 0.2 to 1.0, with major grid lines at 0.2 intervals.
* **X-Axis:** Labeled "Step." The scale ranges from 0 to 120, with major grid lines at 20-step intervals.
* **Legend:** Located in the bottom-right quadrant of the chart area.
* **RLVR:** Represented by a dotted grey line.
* **RLME:** Represented by a solid blue line, accompanied by a light blue shaded region representing the confidence interval or variance.
### Detailed Analysis
**Trend Verification:**
* **RLVR (Dotted Grey Line):** Shows a steep, consistent upward trend from Step 0 to Step 40. After Step 40, the line plateaus, maintaining a relatively stable accuracy between 0.9 and 0.95 for the remainder of the steps.
* **RLME (Solid Blue Line):** Shows a steep upward trend from Step 0 to Step 40, though slightly less aggressive than RLVR. After Step 40, it plateaus around 0.9. The light blue shaded region indicates variance, which appears relatively consistent throughout the training process.
**Data Point Estimates:**
* **Step 0:** RLVR starts at approximately 0.25; RLME starts at approximately 0.35.
* **Step 20:** RLVR reaches approximately 0.75; RLME reaches approximately 0.70.
* **Step 40:** RLVR reaches approximately 0.92; RLME reaches approximately 0.89.
* **Step 60:** RLVR reaches approximately 0.94; RLME reaches approximately 0.91.
* **Step 120:** RLVR maintains approximately 0.93; RLME maintains approximately 0.89.
### Key Observations
* **Performance Crossover:** RLME begins with higher accuracy at Step 0, but RLVR overtakes RLME very early (around Step 10) and maintains a higher accuracy for the duration of the chart.
* **Convergence:** Both models exhibit rapid learning, with the majority of accuracy gains occurring within the first 40 steps.
* **Stability:** RLVR appears to achieve a slightly higher final accuracy (approx. 0.93–0.94) compared to RLME (approx. 0.89).
* **Variance:** The RLME method includes a shaded region indicating uncertainty or variance in its performance, whereas the RLVR method is plotted as a single line without a visible variance band.
### Interpretation
The data demonstrates that while RLME starts with a slight initial advantage, RLVR is the superior method in terms of final accuracy and learning efficiency after the initial warm-up phase. The rapid plateauing after 40 steps suggests that both models reach their peak performance relatively quickly in this training environment. The lack of a shaded region for RLVR might imply either lower variance in its results or simply a difference in how the data was visualized compared to RLME. Overall, RLVR is the more performant model in this specific context.