\n
## Line Chart: Accuracy vs. Step
### Overview
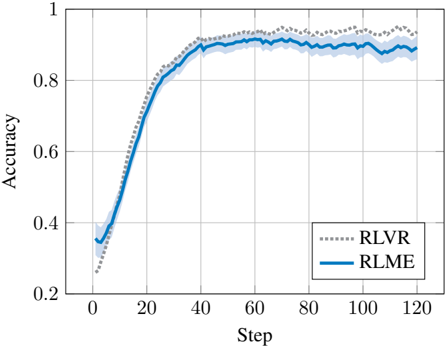
This image presents a line chart comparing the accuracy of two methods, RLVR and RLME, over a series of steps. The chart displays the accuracy on the y-axis and the step number on the x-axis. A shaded region around each line indicates the variance or confidence interval.
### Components/Axes
* **X-axis:** "Step" ranging from approximately 0 to 120.
* **Y-axis:** "Accuracy" ranging from approximately 0.2 to 1.0.
* **Legend:** Located in the top-right corner.
* "RLVR" - Represented by a dotted gray line.
* "RLME" - Represented by a solid blue line.
### Detailed Analysis
* **RLVR (dotted gray line):** The line starts at approximately 0.38 accuracy at Step 0. It increases rapidly, reaching approximately 0.85 accuracy around Step 20. It continues to increase, peaking at approximately 0.92 accuracy around Step 60. After Step 60, the line fluctuates between approximately 0.88 and 0.92 accuracy until Step 120. The shaded region around the line indicates a variance of approximately +/- 0.04.
* **RLME (solid blue line):** The line starts at approximately 0.38 accuracy at Step 0. It increases rapidly, reaching approximately 0.83 accuracy around Step 20. It continues to increase, peaking at approximately 0.91 accuracy around Step 50. After Step 50, the line fluctuates between approximately 0.86 and 0.91 accuracy until Step 120. The shaded region around the line indicates a variance of approximately +/- 0.03.
### Key Observations
* Both RLVR and RLME show a similar trend of increasing accuracy with increasing steps.
* RLVR appears to achieve a slightly higher peak accuracy than RLME, but the difference is minimal.
* Both methods exhibit some fluctuation in accuracy after reaching their peak performance.
* The confidence intervals (shaded regions) are relatively small, suggesting consistent performance for both methods.
### Interpretation
The chart demonstrates that both RLVR and RLME methods are effective in improving accuracy as the number of steps increases. The slight advantage of RLVR in peak accuracy might suggest it is marginally more efficient, but the overall performance of both methods is comparable. The fluctuations in accuracy after the peak could be due to the inherent stochasticity of the learning process or the complexity of the task. The small confidence intervals indicate that the observed trends are statistically reliable. This data suggests that both methods are viable options, and the choice between them might depend on other factors such as computational cost or implementation complexity. The initial rapid increase in accuracy suggests a fast learning rate in the early stages of the process.