## Line Chart: Accuracy vs. Step for RLVR and RLME Methods
### Overview
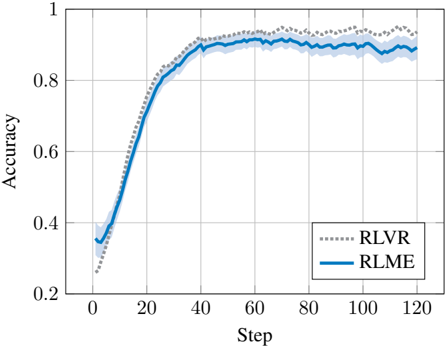
The image is a line chart comparing the performance of two reinforcement learning methods, labeled "RLVR" and "RLME," over the course of 120 training steps. The chart plots "Accuracy" on the vertical axis against "Step" on the horizontal axis. Both methods show a rapid initial increase in accuracy that plateaus after approximately 40-60 steps. The RLVR method (dotted gray line) ultimately achieves a slightly higher final accuracy than the RLME method (solid blue line).
### Components/Axes
* **Chart Type:** Line chart with shaded confidence intervals.
* **X-Axis:**
* **Label:** "Step"
* **Scale:** Linear, from 0 to 120.
* **Major Tick Marks:** 0, 20, 40, 60, 80, 100, 120.
* **Y-Axis:**
* **Label:** "Accuracy"
* **Scale:** Linear, from 0.2 to 1.0.
* **Major Tick Marks:** 0.2, 0.4, 0.6, 0.8, 1.0.
* **Legend:**
* **Position:** Bottom-right corner of the plot area.
* **Entries:**
1. **RLVR:** Represented by a dotted gray line (`...`).
2. **RLME:** Represented by a solid blue line (`—`).
* **Data Series:**
* **RLVR (Dotted Gray Line):** Shows a steep initial ascent, crossing above the RLME line around step 40, and maintains a slight lead thereafter.
* **RLME (Solid Blue Line):** Shows a steep initial ascent, plateaus slightly earlier than RLVR, and remains consistently below the RLVR line after step 40.
* **Shaded Areas:** Both lines are accompanied by a semi-transparent shaded region of the same color (light gray for RLVR, light blue for RLME), indicating the variance or confidence interval around the mean performance.
### Detailed Analysis
* **Initial Performance (Steps 0-20):**
* Both methods start at a similar low accuracy. At step 0, accuracy is approximately 0.35 for RLME and 0.25 for RLVR.
* Both lines rise sharply and nearly identically until approximately step 20, where accuracy reaches ~0.75 for both.
* **Crossover and Plateau (Steps 20-60):**
* The RLVR line begins to ascend slightly faster than RLME around step 30.
* **Crossover Point:** The RLVR line crosses above the RLME line at approximately **step 40**. At this point, accuracy for both is near 0.85.
* After step 40, RLVR maintains a consistent, small lead. Both curves begin to flatten, indicating a plateau in learning.
* **Final Performance (Steps 60-120):**
* **RLVR (Dotted Gray):** Reaches a plateau with an accuracy fluctuating between approximately **0.90 and 0.95**. The final value at step 120 is approximately **0.93**.
* **RLME (Solid Blue):** Plateaus at a slightly lower level, with accuracy fluctuating between approximately **0.85 and 0.90**. The final value at step 120 is approximately **0.88**.
* The shaded confidence intervals for both methods overlap significantly throughout the plateau phase, suggesting the performance difference, while consistent, may not be statistically large.
### Key Observations
1. **Similar Learning Trajectory:** Both RLVR and RLME follow a very similar learning curve shape: rapid improvement followed by a plateau.
2. **Performance Crossover:** RLVR demonstrates a slightly faster rate of improvement in the mid-training phase (steps 30-40), allowing it to overtake RLME.
3. **Consistent Final Gap:** After the crossover, RLVR maintains a small but consistent performance advantage over RLME for the remainder of the training steps shown.
4. **Plateau Behavior:** Both methods show noisy plateaus, with accuracy oscillating within a narrow band rather than converging to a single flat line. This is typical of stochastic training processes.
5. **Variance:** The width of the shaded confidence intervals appears relatively constant for both methods after the initial learning phase, suggesting stable variance in performance across runs.
### Interpretation
The chart suggests that while both the RLVR and RLME reinforcement learning methods are effective and learn at a comparable overall rate, **RLVR has a slight performance edge** in this specific task. The key differentiator emerges during the mid-training phase (around step 40), where RLVR's learning efficiency appears marginally better, allowing it to achieve a higher final accuracy.
The fact that the curves are so close and their confidence intervals overlap indicates that the advantage of RLVR, while visually present, might be modest. In a practical setting, the choice between methods might depend on other factors like computational cost or stability, as the accuracy difference is not dramatic. The plateauing of both curves after 60 steps implies that further training beyond 120 steps with these settings may yield diminishing returns, and alternative strategies (e.g., adjusting learning rates, using different exploration policies) might be needed to push accuracy closer to 1.0.