## Heatmap: Grid of Colored Cells with Numerical Annotations
### Overview
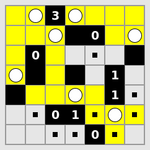
The image depicts a 6x6 grid composed of colored cells (yellow, black, gray, white) with embedded numerical values (0, 1, 3) and white circular markers. A legend in the top-left corner associates colors with numerical values: yellow = 0, black = 1, gray = 3. Some cells contain white circles, which are not explicitly defined in the legend.
### Components/Axes
- **Legend**: Located in the top-left corner, mapping colors to numerical values:
- Yellow → 0
- Black → 1
- Gray → 3
- **Grid Structure**:
- 6 rows and 6 columns.
- No explicit axis labels or titles.
- Cells vary in color and content (numbers or circles).
### Detailed Analysis
- **Color-Number Consistency**:
- Yellow cells (0) often contain the number "0" (e.g., top-left cell).
- Black cells (1) frequently display "1" (e.g., row 3, column 2).
- Gray cells (3) are less common and sometimes contain "3" (e.g., row 2, column 4).
- **White Circles**:
- Present in 12 cells (e.g., row 1, column 2; row 4, column 5).
- No explicit legend entry for circles; their purpose is unclear.
- **Numerical Values**:
- Numbers "0", "1", and "3" are embedded in cells, often matching the color's legend value.
- Some cells contain both a number and a circle (e.g., row 3, column 5: "1" with a circle).
### Key Observations
1. **Color-Number Alignment**: Most cells adhere to the legend (e.g., yellow = 0, black = 1).
2. **Circular Markers**: White circles appear in cells with varying colors and numbers, suggesting a secondary categorization.
3. **Distribution**:
- "0" (yellow) and "1" (black) dominate the grid.
- "3" (gray) is sparse, appearing only in 3 cells.
4. **Anomalies**:
- A gray cell (row 2, column 4) contains "3" but no circle.
- A yellow cell (row 5, column 3) has a circle but no number.
### Interpretation
The grid likely represents a categorical dataset where colors encode primary values (0, 1, 3) and white circles denote a secondary attribute (e.g., "active" or "highlighted" status). The prevalence of "0" and "1" suggests a binary or ternary classification system, while the sparse "3" values may indicate rare or special cases. The circles could signify exceptions, priorities, or additional metadata not captured by the color coding. The lack of axis labels or contextual text limits interpretation, but the structured layout implies a systematic categorization, possibly for data visualization or decision-making.