\n
## 3D Surface Plot: Minimized Energy Landscape
### Overview
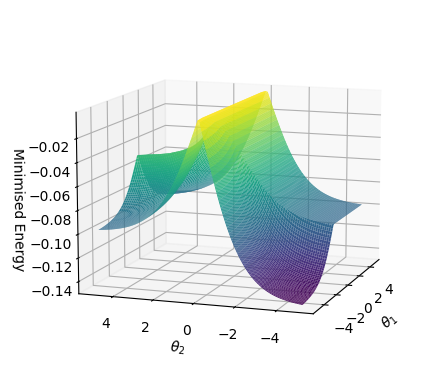
The image presents a 3D surface plot visualizing a minimized energy landscape. The plot depicts the relationship between two parameters, θ₁ and θ₂, and their corresponding minimized energy value. The surface is colored to represent varying energy levels, with cooler colors (greens and blues) indicating lower energy and warmer colors (yellows and reds) indicating higher energy.
### Components/Axes
* **X-axis:** θ₁ ranging from approximately -4 to 4.
* **Y-axis:** θ₂ ranging from approximately -4 to 4.
* **Z-axis:** Minimized Energy ranging from approximately -0.14 to -0.02.
* **Surface:** Represents the minimized energy as a function of θ₁ and θ₂.
* **Color Gradient:** A continuous color gradient is used to represent the energy levels. The gradient appears to transition from purple (lowest energy) to green, yellow, and finally to a lighter shade of green/yellow (highest energy).
### Detailed Analysis
The surface exhibits two distinct minima (valleys).
* **Left Minimum:** Located around θ₁ ≈ -4 and θ₂ ≈ 2, with a minimized energy of approximately -0.13 to -0.14. The surface rises relatively steeply on either side of this minimum.
* **Right Minimum:** Located around θ₁ ≈ 4 and θ₂ ≈ -2, with a minimized energy of approximately -0.13 to -0.14. Similar to the left minimum, the surface rises steeply around this point.
* **Central Ridge:** A ridge of higher energy (yellow/green) runs between the two minima, peaking around θ₁ ≈ 0 and θ₂ ≈ 0, with a minimized energy of approximately -0.02 to -0.04.
* **Symmetry:** The plot appears roughly symmetric about the line θ₁ = θ₂ = 0, although there are subtle differences in the shape of the surface around each minimum.
### Key Observations
* The energy landscape has multiple local minima, suggesting the possibility of multiple stable states.
* The steepness of the surface around the minima indicates that small changes in θ₁ or θ₂ can lead to significant changes in energy.
* The central ridge represents an unstable state, as any small perturbation would likely cause the system to move towards one of the minima.
### Interpretation
This plot likely represents the result of an optimization process or a simulation of a physical system. The two minima suggest two possible stable configurations or states of the system. The energy values at these minima indicate the relative stability of each state. The shape of the surface and the presence of the central ridge provide information about the energy barriers between the different states.
The plot demonstrates a complex energy landscape with multiple potential energy wells. This type of landscape is common in many physical and chemical systems, and understanding its features is crucial for predicting the behavior of the system. The visualization allows for a quick assessment of the system's stability and the ease with which it can transition between different states. The data suggests that the system will tend to settle into one of the two minima, but the specific state it reaches may depend on initial conditions and external factors.