## 3D Surface Plot: Minimised Energy Landscape
### Overview
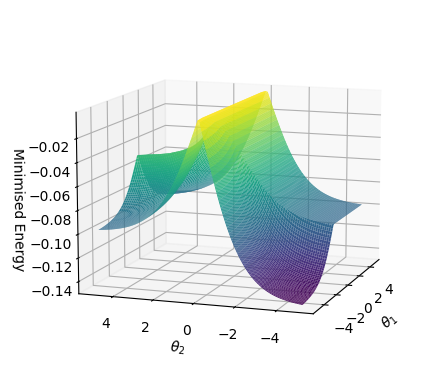
The image depicts a 3D surface plot visualizing a minimised energy landscape as a function of two angular variables, θ₁ and θ₂. The plot uses a color gradient (purple to yellow) to represent energy values, with a grid overlay for spatial reference. The surface exhibits multiple peaks, troughs, and saddle points, suggesting a complex energy distribution.
### Components/Axes
- **X-axis (θ₂)**: Ranges from -4 to 4, labeled with increments of 2.
- **Y-axis (θ₁)**: Ranges from -4 to 4, labeled with increments of 2.
- **Z-axis (Minimised Energy)**: Ranges from -0.14 to -0.02, with increments of 0.02.
- **Color Gradient**:
- Purple (low energy, ~-0.14) to Yellow (high energy, ~-0.02).
- No explicit legend, but color intensity correlates with energy values.
- **Grid**: 3D grid lines in gray, providing spatial context for the surface.
### Detailed Analysis
1. **Peaks**:
- **Highest Peak**: Located at θ₂ ≈ 0, θ₁ ≈ 0, with energy ≈ -0.02 (yellow region).
- **Secondary Peak**: Near θ₂ ≈ 2, θ₁ ≈ 2, with energy ≈ -0.04 (green-yellow transition).
2. **Troughs**:
- **Deepest Trough**: At θ₂ ≈ -4, θ₁ ≈ -4, with energy ≈ -0.14 (dark purple).
- **Secondary Trough**: Near θ₂ ≈ -2, θ₁ ≈ 2, with energy ≈ -0.08 (blue-green).
3. **Saddle Point**:
- A critical point at θ₂ ≈ 2, θ₁ ≈ 2, where the surface transitions from rising to falling in orthogonal directions.
4. **Surface Shape**:
- The plot resembles a "double-well" potential with asymmetric wells, influenced by the interaction between θ₁ and θ₂.
### Key Observations
- The energy landscape is non-uniform, with localized minima and maxima.
- The saddle point at (2, 2) suggests a critical configuration where small perturbations could lead to transitions between states.
- Energy values are consistently negative, indicating a bounded system (e.g., potential energy relative to a reference).
### Interpretation
This plot likely represents a **potential energy surface** in a physical or optimization context. The double-well structure implies multiple stable states (minima) separated by an energy barrier (saddle point). The asymmetry in well depths suggests preferential stability in certain configurations (e.g., θ₂ ≈ -4, θ₁ ≈ -4). The color gradient confirms that energy values are directly proportional to surface height, with no anomalies in the mapping. The plot could model phenomena such as molecular conformations, mechanical stability, or parameter optimization landscapes.