## Chart: Microphone Frequency Response Comparison
### Overview
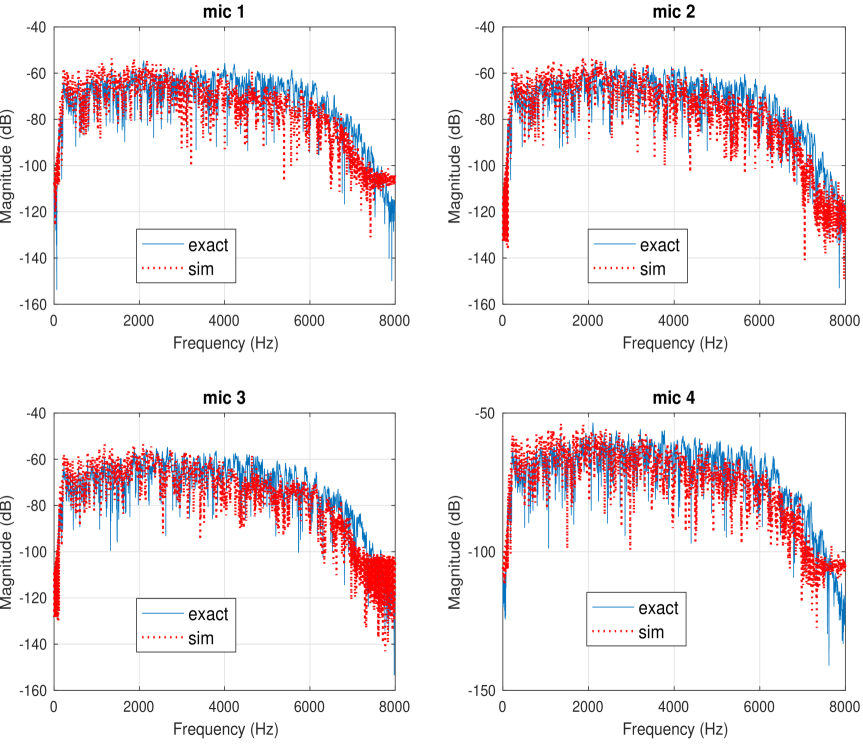
The image presents four line charts arranged in a 2x2 grid, each displaying the frequency response of a microphone. Each chart compares an "exact" (blue solid line) response with a "sim" (red dotted line) response. The x-axis represents frequency in Hertz (Hz), ranging from 0 to 8000 Hz. The y-axis represents magnitude in decibels (dB), with varying ranges for each microphone.
### Components/Axes
* **Titles:** Each chart is titled "mic 1", "mic 2", "mic 3", and "mic 4" respectively.
* **X-axis:** Frequency (Hz), ranging from 0 to 8000 Hz in all four charts.
* **Y-axis:** Magnitude (dB). The ranges vary:
* mic 1: -160 dB to -40 dB
* mic 2: -160 dB to -40 dB
* mic 3: -160 dB to -40 dB
* mic 4: -150 dB to -50 dB
* **Legend:** Located within each chart, indicating "exact" (blue solid line) and "sim" (red dotted line).
### Detailed Analysis
**mic 1:**
* **Exact (blue):** The magnitude starts around -60 dB at low frequencies, fluctuates, and then decreases to approximately -110 dB at 8000 Hz.
* **Sim (red):** The magnitude starts around -60 dB, fluctuates similarly to the "exact" line, and decreases to approximately -120 dB at 8000 Hz.
* **Trend:** Both lines show a general downward trend as frequency increases, with the "sim" line showing more fluctuation.
**mic 2:**
* **Exact (blue):** The magnitude starts around -60 dB, fluctuates, and decreases to approximately -120 dB at 8000 Hz.
* **Sim (red):** The magnitude starts around -60 dB, fluctuates similarly to the "exact" line, and decreases to approximately -120 dB at 8000 Hz.
* **Trend:** Both lines show a general downward trend as frequency increases, with the "sim" line showing more fluctuation.
**mic 3:**
* **Exact (blue):** The magnitude starts around -60 dB, fluctuates, and decreases to approximately -140 dB at 8000 Hz.
* **Sim (red):** The magnitude starts around -60 dB, fluctuates similarly to the "exact" line, and decreases to approximately -120 dB at 8000 Hz.
* **Trend:** Both lines show a general downward trend as frequency increases, with the "sim" line showing more fluctuation.
**mic 4:**
* **Exact (blue):** The magnitude starts around -50 dB, fluctuates, and decreases to approximately -110 dB at 8000 Hz.
* **Sim (red):** The magnitude starts around -50 dB, fluctuates similarly to the "exact" line, and decreases to approximately -110 dB at 8000 Hz.
* **Trend:** Both lines show a general downward trend as frequency increases, with the "sim" line showing more fluctuation.
### Key Observations
* The "exact" and "sim" responses are generally similar for each microphone, especially at lower frequencies.
* The "sim" response tends to show more fluctuation than the "exact" response.
* All microphones exhibit a decrease in magnitude as frequency increases.
* The magnitude ranges are slightly different for mic 4 compared to the other microphones.
### Interpretation
The charts compare the frequency response of four microphones, contrasting an "exact" measurement with a "simulated" response. The data suggests that the simulation closely approximates the actual microphone response, particularly at lower frequencies. The increased fluctuation in the "sim" response could be due to limitations in the simulation model or noise in the simulation environment. The overall downward trend indicates that the microphones are less sensitive to higher frequencies. The slight differences in magnitude range for mic 4 may indicate variations in the microphone's design or calibration.