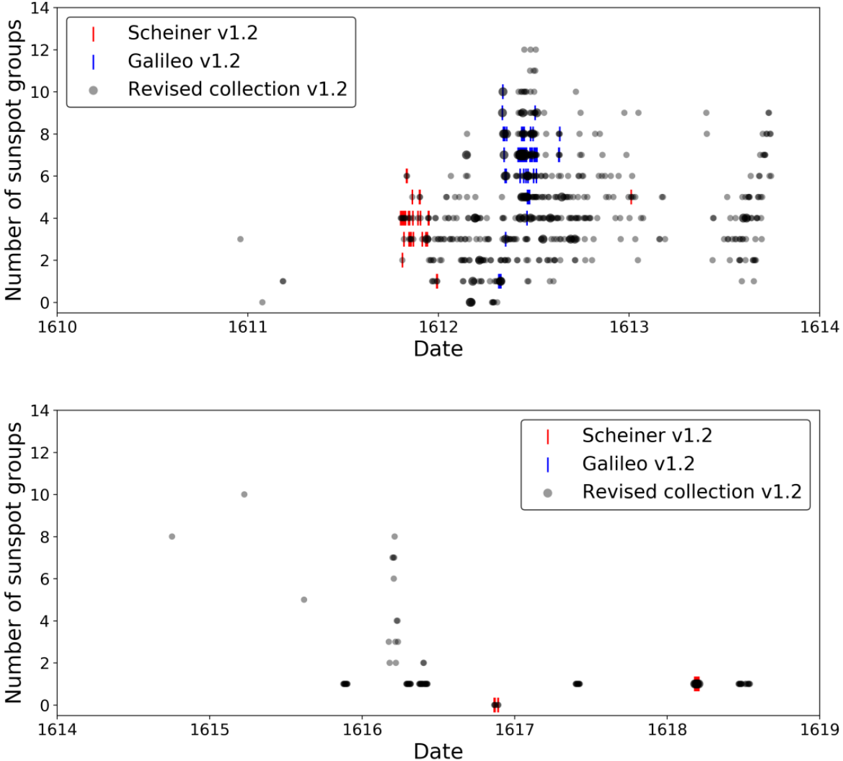
## Scatter Plot: Sunspot Group Counts Over Time
### Overview
The image contains two scatter plots displaying the number of sunspot groups observed over time, spanning from 1610 to 1619. The plots compare data from three sources: Scheiner v1.2, Galileo v1.2, and a Revised collection v1.2. The first plot focuses on the period from 1610 to 1614, while the second plot covers 1614 to 1619.
### Components/Axes
* **Y-axis (both plots):** "Number of sunspot groups", ranging from 0 to 14. Axis markers are present at every increment of 2 (0, 2, 4, 6, 8, 10, 12, 14).
* **X-axis (both plots):** "Date", with the first plot spanning from 1610 to 1614 and the second plot spanning from 1614 to 1619. Axis markers are present at each year increment.
* **Legend (top-left in both plots):**
* Red: "Scheiner v1.2"
* Blue: "Galileo v1.2"
* Gray: "Revised collection v1.2"
### Detailed Analysis
**Top Plot (1610-1614):**
* **Scheiner v1.2 (Red):** Data points are clustered around 1612, with values ranging approximately from 2 to 6 sunspot groups. Error bars are visible on some points, indicating uncertainty. The trend is relatively stable around 1612.
* **Galileo v1.2 (Blue):** Data points are clustered around 1612, with values ranging approximately from 6 to 12 sunspot groups. Error bars are visible. The trend is relatively stable around 1612.
* **Revised collection v1.2 (Gray):** Data points are scattered throughout the period, with a higher concentration between 1612 and 1614. Values range from 0 to 12 sunspot groups.
**Bottom Plot (1614-1619):**
* **Scheiner v1.2 (Red):** Very few data points are present. One data point is near 1617 with a value of approximately 1, and another is near 1618 with a value of approximately 1. Error bars are visible.
* **Galileo v1.2 (Blue):** No data points are present.
* **Revised collection v1.2 (Gray):** Data points are sparse. There are points around 1615 (approximately 8 and 10), 1616 (approximately 1, 2, 4, 6, and 8), 1617 (approximately 0), 1618 (approximately 2), and 1619 (approximately 0).
### Key Observations
* The top plot shows a period of higher sunspot activity around 1612-1613, according to all three data sources.
* The bottom plot shows a period of significantly lower sunspot activity from 1614 to 1619.
* Galileo v1.2 data is only present in the first plot (1610-1614).
* Scheiner v1.2 data is sparse in the second plot (1614-1619).
* The Revised collection v1.2 data is present in both plots, but is more scattered in the second plot.
### Interpretation
The plots illustrate the variation in sunspot group counts over time, as recorded by different observers and collections. The data suggests a period of higher solar activity around 1612-1613, followed by a period of lower activity from 1614 to 1619. The differences in data between Scheiner, Galileo, and the Revised collection may reflect variations in observational techniques, data processing, or the specific periods they observed. The sparse data in the second plot for Scheiner and the absence of Galileo's data suggest that these observers may not have been actively recording sunspot data during that period, or that the data is not available in the analyzed collection. The "Revised collection v1.2" appears to provide a more continuous record across the entire time span, although the data is still sparse in the later years. The error bars indicate the uncertainty associated with some of the measurements, which should be considered when interpreting the data.