## Line Charts: Sunspot Group Activity (1610-1619)
### Overview
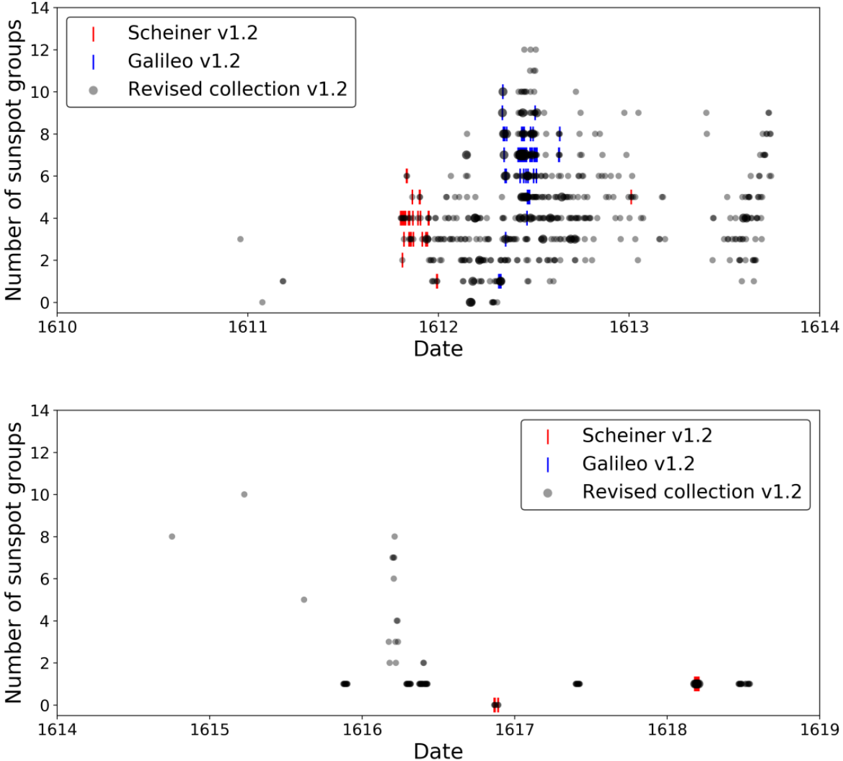
Two line charts display sunspot group activity over time, comparing three datasets: Scheiner v1.2 (red), Galileo v1.2 (blue), and Revised collection v1.2 (gray). The x-axis represents years (1610–1619), and the y-axis shows the number of sunspot groups (0–14). Data points are plotted with error bars, and trends are visualized through line segments connecting markers.
---
### Components/Axes
- **X-axis (Date)**: Labeled "Date," spanning 1610 to 1619 in annual increments.
- **Y-axis (Number of sunspot groups)**: Labeled "Number of sunspot groups," ranging from 0 to 14.
- **Legend**: Positioned in the top-left corner of both charts, with:
- Red line: Scheiner v1.2
- Blue line: Galileo v1.2
- Gray dots: Revised collection v1.2
- **Markers**:
- Red vertical lines (Scheiner)
- Blue vertical lines (Galileo)
- Gray circles (Revised collection)
---
### Detailed Analysis
#### Top Chart (1610–1614)
- **Scheiner v1.2 (red)**:
- Peaks at ~12 sunspot groups in 1612–1613.
- Drops to ~4 groups by 1614.
- Error bars suggest variability of ±1–2 groups.
- **Galileo v1.2 (blue)**:
- Peaks at ~10 groups in 1613.
- Declines to ~6 groups by 1614.
- Error bars indicate ±1–2 groups.
- **Revised collection v1.2 (gray)**:
- Scattered data points align with Scheiner/Galileo peaks but show higher variability (e.g., 8–10 groups in 1612–1613).
#### Bottom Chart (1614–1619)
- **Scheiner v1.2 (red)**:
- Peaks at ~8 groups in 1615.
- Drops to ~2 groups by 1617.
- Error bars: ±1–2 groups.
- **Galileo v1.2 (blue)**:
- Peaks at ~10 groups in 1615–1616.
- Declines to ~4 groups by 1618.
- Error bars: ±1–2 groups.
- **Revised collection v1.2 (gray)**:
- Peaks at ~10 groups in 1615–1616.
- Drops to ~2 groups by 1618.
- Higher variability than other datasets (e.g., 6–8 groups in 1617).
---
### Key Observations
1. **Peak Activity (1612–1616)**:
- All datasets show elevated sunspot activity between 1612–1616, with Scheiner and Galileo peaking earlier (1612–1613) and the Revised collection peaking later (1615–1616).
2. **Decline Post-1616**:
- A consistent drop in sunspot groups occurs after 1616 across all datasets, suggesting a solar cycle transition.
3. **Dataset Discrepancies**:
- The Revised collection exhibits broader variability, potentially indicating updated or combined observational methods.
4. **Temporal Alignment**:
- Scheiner and Galileo datasets overlap significantly in 1613–1614 but diverge in later years.
---
### Interpretation
The data suggests a shared period of heightened solar activity (1612–1616) across all datasets, with the Revised collection potentially reconciling historical records. The decline after 1616 aligns with known solar cycle patterns, though the Revised collection’s later peaks may reflect improved data calibration. Discrepancies between Scheiner and Galileo highlight methodological differences in historical observations. The error bars indicate measurement uncertainty, emphasizing the need for cautious interpretation of pre-modern solar data.