# Technical Document Extraction: Signal Fraction vs Temperature
## Main Graph
### Axes
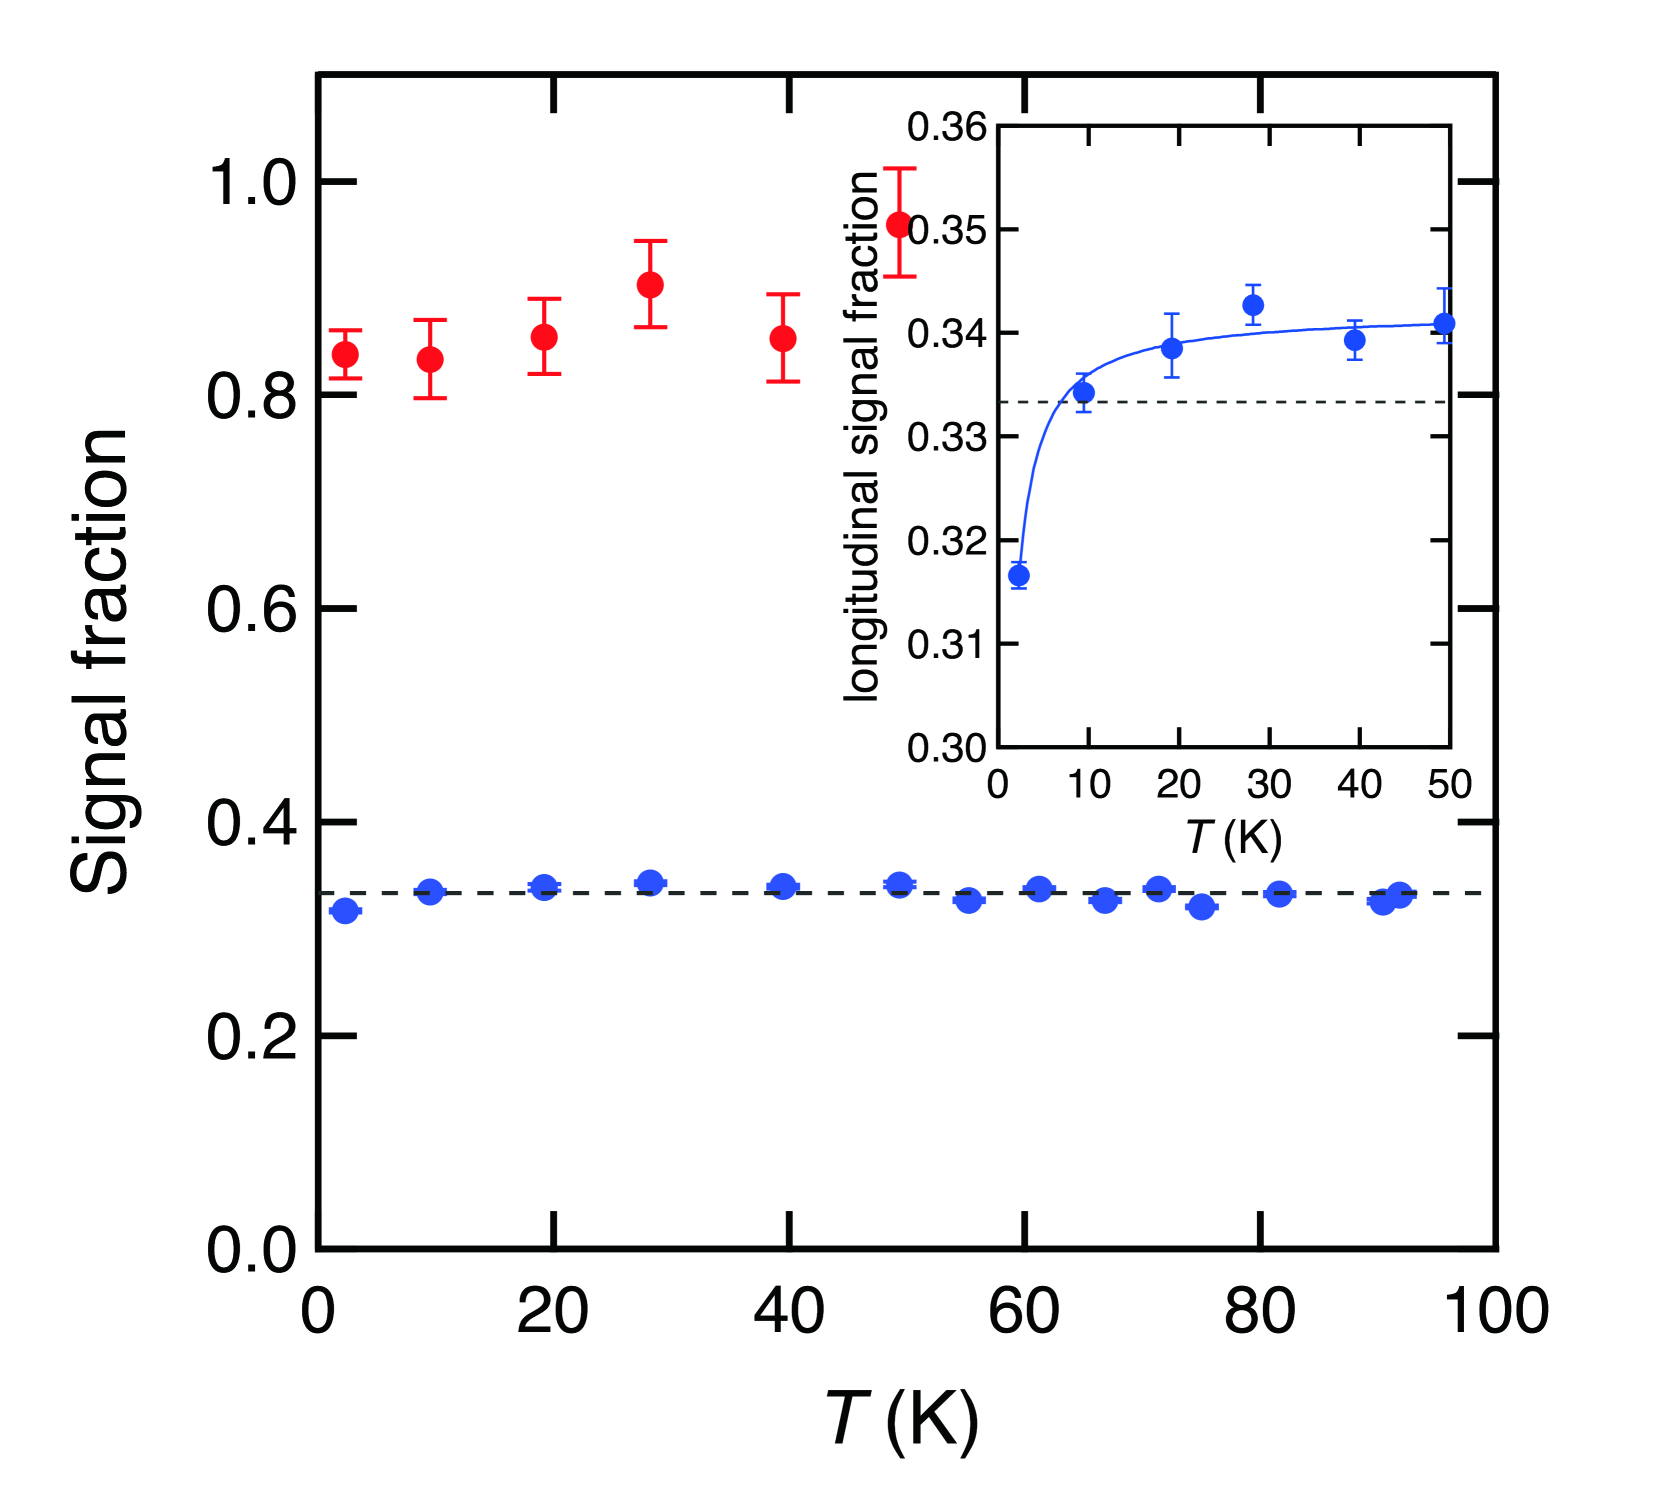
- **X-axis**: Temperature (T) in Kelvin (K), ranging from 0 to 100.
- **Left Y-axis**: Signal fraction (red data points).
- **Right Y-axis**: Longitudinal signal fraction (blue data points).
### Data Trends
1. **Signal Fraction (Red Dots)**:
- Values range from ~0.82 to ~0.9.
- Slightly decreasing trend with increasing temperature.
- Error bars present (vertical lines), indicating measurement uncertainty.
2. **Longitudinal Signal Fraction (Blue Dots)**:
- Values range from ~0.31 to ~0.36.
- Sigmoidal increase observed, plateauing near 0.36 at higher temperatures.
- Error bars present (vertical lines).
### Inset Graph
- **Purpose**: Zoomed-in view of longitudinal signal fraction (blue data) for T = 0–50 K.
- **Key Features**:
- Dashed horizontal line at ~0.33 (reference value).
- Data points show a steep rise between 10–30 K, then gradual saturation.
### Legend
- **Red**: Signal fraction.
- **Blue**: Longitudinal signal fraction.
## Observations
1. The longitudinal signal fraction exhibits a temperature-dependent saturation behavior, reaching ~36% at higher temperatures.
2. The signal fraction remains relatively stable (~82–90%) across the measured temperature range.
3. Error bars suggest experimental precision within ±0.01–0.02 for both measurements.
## Structural Notes
- Dual-axis plot design emphasizes independent trends of two related but distinct physical quantities.
- Inset provides detailed resolution of low-temperature behavior critical for modeling.