\n
## Diagram: AI Interpretability Research Lifecycle
### Overview
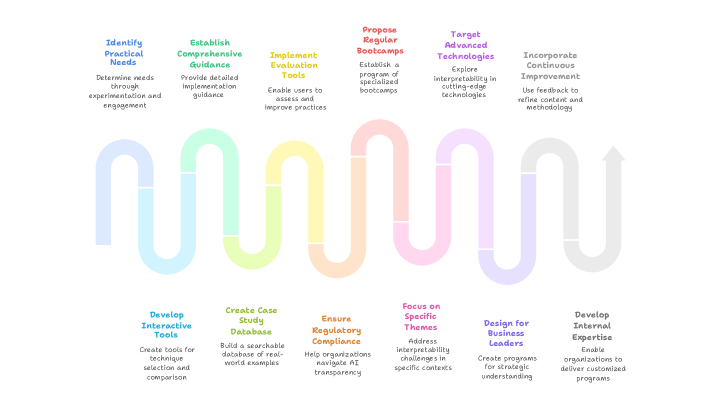
The image depicts a cyclical diagram illustrating a research lifecycle focused on AI Interpretability. It consists of six main stages arranged in a loop, connected by curved arrows. Each stage is represented by a colored rectangle containing a title and a brief description. The diagram appears to represent a continuous process of improvement and refinement in the field of AI interpretability research.
### Components/Axes
The diagram is composed of the following stages, listed in clockwise order starting from the top-left:
1. **Identify Practical Needs:** (Purple) - "Determine needs through experimentation and engagement"
2. **Establish Comprehensive Guidance:** (Dark Blue) - "Provide detailed implementation guidance"
3. **Implement Evaluation Tools:** (Green) - "Enable users to assess and improve practices"
4. **Propose Regular Bootcamps:** (Yellow) - "Establish a program of specialized bootcamps"
5. **Target Advanced Technologies:** (Light Blue) - "Explore interpretability in cutting-edge technologies"
6. **Incorporate Continuous Improvement:** (Orange) - "Use feedback to refine content and methodology"
7. **Develop Interactive Tools:** (Light Purple) - "Create tools for technique selection and comparison"
8. **Create Case Study Database:** (Pink) - "Build a searchable database of real-world examples"
9. **Ensure Regulatory Compliance:** (Red) - "Help organizations navigate AI transparency"
10. **Focus on Specific Themes:** (Dark Green) - "Address interpretability challenges in specific contexts"
11. **Design for Business Leaders:** (Brown) - "Create programs for strategic understanding"
12. **Develop Internal Expertise:** (Teal) - "Enable organizations to deliver customized programs"
The curved arrows connecting the stages are light gray and indicate the cyclical nature of the process.
### Detailed Analysis or Content Details
The diagram doesn't contain numerical data. It's a conceptual representation of a process. The stages are arranged in a loop, suggesting a continuous cycle of research, development, and implementation. The descriptions within each stage provide a brief overview of the activities involved.
The color scheme is used to visually differentiate the stages. The arrangement of the stages suggests a flow from identifying needs to incorporating improvements, and then back to identifying new needs.
### Key Observations
The diagram emphasizes the importance of a holistic approach to AI interpretability, encompassing practical needs, guidance, tools, education, advanced technologies, and continuous improvement. The inclusion of regulatory compliance and business leader engagement highlights the real-world relevance of the research. The cyclical nature of the diagram suggests that the process is iterative and requires ongoing refinement.
### Interpretation
This diagram illustrates a comprehensive framework for advancing AI interpretability. It's not merely a technical research process, but also incorporates elements of education (bootcamps), practical application (evaluation tools, case studies), and stakeholder engagement (regulatory compliance, business leaders). The cyclical nature emphasizes the need for continuous learning and adaptation in this rapidly evolving field.
The diagram suggests that successful AI interpretability research requires a multi-disciplinary approach, bringing together researchers, practitioners, regulators, and business leaders. The emphasis on practical needs and continuous improvement indicates a commitment to developing solutions that are both theoretically sound and practically useful. The inclusion of a case study database suggests a focus on learning from real-world examples and applying those lessons to future research and development efforts.
The diagram is a high-level overview and doesn't delve into the specific methods or techniques used in each stage. However, it provides a valuable roadmap for anyone involved in AI interpretability research or implementation.