## Chart: Cross Sections of Convex Function
### Overview
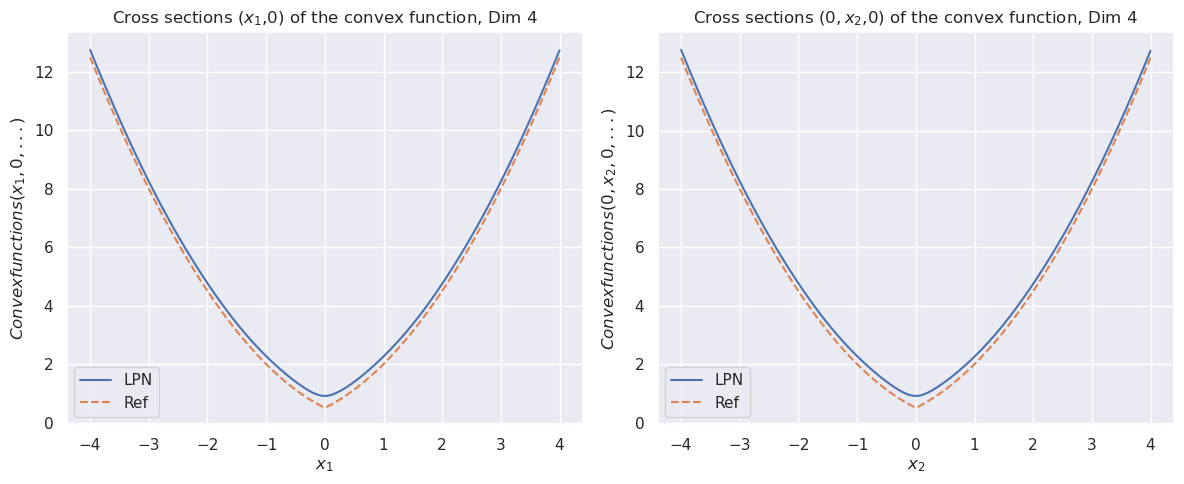
The image presents two line charts side-by-side, both displaying cross-sections of a convex function in 4 dimensions. The left chart shows the cross-section (x1, 0), while the right chart shows (0, x2, 0). Each chart plots two data series: "LPN" (solid blue line) and "Ref" (dashed orange line). Both charts exhibit a similar U-shaped curve, indicating a convex function.
### Components/Axes
**Left Chart:**
* **Title:** Cross sections (x1,0) of the convex function, Dim 4
* **Y-axis:** Convexfunctions(x1, 0, ...)
* Scale: 0 to 12, with tick marks at every increment of 2.
* **X-axis:** x1
* Scale: -4 to 4, with tick marks at every increment of 1.
* **Legend:** Located in the bottom-left corner.
* LPN: Solid blue line
* Ref: Dashed orange line
**Right Chart:**
* **Title:** Cross sections (0, x2,0) of the convex function, Dim 4
* **Y-axis:** Convexfunctions(0, x2, 0, ...)
* Scale: 0 to 12, with tick marks at every increment of 2.
* **X-axis:** x2
* Scale: -4 to 4, with tick marks at every increment of 1.
* **Legend:** Located in the bottom-left corner.
* LPN: Solid blue line
* Ref: Dashed orange line
### Detailed Analysis
**Left Chart (x1, 0):**
* **LPN (Solid Blue):** The line forms a U-shape. It starts at approximately (x1 = -4, Convexfunctions = 12.5), decreases to a minimum around (x1 = 0, Convexfunctions = 0.75), and then increases to approximately (x1 = 4, Convexfunctions = 12.5).
* **Ref (Dashed Orange):** The line also forms a U-shape, closely following the LPN line but generally slightly below it. It starts at approximately (x1 = -4, Convexfunctions = 11.5), decreases to a minimum around (x1 = 0, Convexfunctions = 0.5), and then increases to approximately (x1 = 4, Convexfunctions = 11.5).
**Right Chart (0, x2, 0):**
* **LPN (Solid Blue):** The line forms a U-shape. It starts at approximately (x2 = -4, Convexfunctions = 12.5), decreases to a minimum around (x2 = 0, Convexfunctions = 0.75), and then increases to approximately (x2 = 4, Convexfunctions = 12.5).
* **Ref (Dashed Orange):** The line also forms a U-shape, closely following the LPN line but generally slightly below it. It starts at approximately (x2 = -4, Convexfunctions = 11.5), decreases to a minimum around (x2 = 0, Convexfunctions = 0.5), and then increases to approximately (x2 = 4, Convexfunctions = 11.5).
### Key Observations
* Both charts show very similar curves for LPN and Ref, indicating symmetry in the convex function with respect to x1 and x2.
* The "Ref" data series consistently shows slightly lower values than the "LPN" series across both charts.
* The minimum value of both curves occurs at x1 = 0 and x2 = 0, respectively.
### Interpretation
The charts illustrate the cross-sections of a 4-dimensional convex function along two different planes (x1, 0) and (0, x2). The similarity between the two charts suggests that the function is symmetric with respect to the x1 and x2 axes. The "LPN" and "Ref" curves represent two different methods or models for approximating or representing this convex function. The fact that "Ref" consistently yields slightly lower values than "LPN" might indicate that "Ref" is a more conservative or lower-bound estimate of the function's value compared to "LPN". The data suggests that both "LPN" and "Ref" are reasonable approximations of the underlying convex function, with "LPN" potentially being slightly more optimistic or aggressive in its estimation.