## Line Graphs: Cross Sections of a Convex Function in 4D Space
### Overview
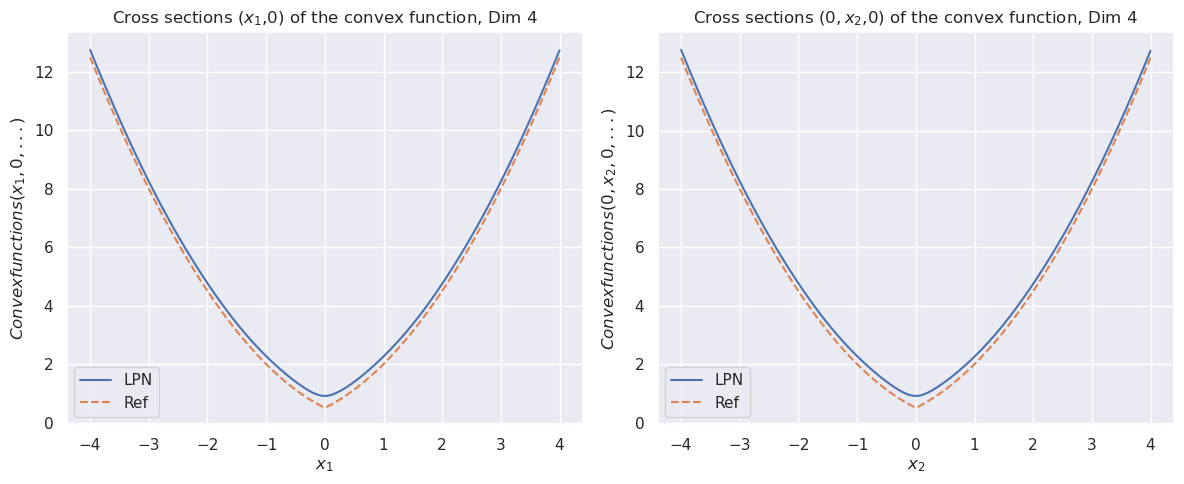
The image contains two side-by-side line graphs comparing the performance of an LPN (Learning-based Prediction Network) model against a reference (Ref) model for cross-sectional analysis of a convex function in 4D space. Both graphs depict U-shaped curves, characteristic of convex functions, with axes labeled for spatial dimensions and function values.
---
### Components/Axes
1. **Left Graph**:
- **Title**: "Cross sections (x₁,0) of the convex function, Dim 4"
- **X-axis**: Labeled `x₁`, ranging from -4 to 4 in integer increments.
- **Y-axis**: Labeled `Convexfunctions(x₁,0, ..., )`, with values from 0 to 12.
- **Legend**:
- Solid blue line: "LPN"
- Dashed orange line: "Ref"
- **Legend Position**: Bottom-left corner.
2. **Right Graph**:
- **Title**: "Cross sections (0,x₂,0) of the convex function, Dim 4"
- **X-axis**: Labeled `x₂`, ranging from -4 to 4 in integer increments.
- **Y-axis**: Labeled `Convexfunctions(0,x₂,0, ..., )`, with values from 0 to 12.
- **Legend**: Same as left graph (solid blue = LPN, dashed orange = Ref).
- **Legend Position**: Bottom-left corner.
---
### Detailed Analysis
1. **Left Graph (x₁-axis)**:
- **LPN Line (Solid Blue)**:
- Starts at ~12.5 when `x₁ = -4`, decreases to a minimum of ~0.5 at `x₁ = 0`, then increases back to ~12.5 at `x₁ = 4`.
- Slope: Steeper near the edges (`x₁ = ±4`) and flatter near the minimum (`x₁ = 0`).
- **Ref Line (Dashed Orange)**:
- Mirrors the LPN line closely, with minor deviations (e.g., ~0.1–0.2 units lower at `x₁ = 0`).
- **Key Data Points**:
- `x₁ = -4`: LPN ≈ 12.5, Ref ≈ 12.3
- `x₁ = 0`: LPN ≈ 0.5, Ref ≈ 0.3
- `x₁ = 4`: LPN ≈ 12.5, Ref ≈ 12.2
2. **Right Graph (x₂-axis)**:
- **LPN Line (Solid Blue)**:
- Identical shape to the left graph, with the same minimum (~0.5 at `x₂ = 0`) and peaks (~12.5 at `x₂ = ±4`).
- **Ref Line (Dashed Orange)**:
- Again closely matches LPN, with similar minor deviations.
- **Key Data Points**:
- `x₂ = -4`: LPN ≈ 12.5, Ref ≈ 12.3
- `x₂ = 0`: LPN ≈ 0.5, Ref ≈ 0.3
- `x₂ = 4`: LPN ≈ 12.5, Ref ≈ 12.2
---
### Key Observations
1. **Symmetry**: Both graphs exhibit perfect symmetry about their respective axes (`x₁ = 0` and `x₂ = 0`), consistent with convex function properties.
2. **Model Agreement**: The LPN and Ref lines are nearly identical across all data points, suggesting the LPN model closely approximates the reference.
3. **Convexity**: The U-shaped curves confirm the convex nature of the function, with a single global minimum at the origin (`x₁ = 0` or `x₂ = 0`).
4. **Dimensional Consistency**: The identical behavior in both `x₁` and `x₂` cross-sections implies the convex function is isotropic in these dimensions.
---
### Interpretation
1. **Model Validation**: The near-perfect overlap of LPN and Ref lines indicates the LPN model is highly accurate in predicting the convex function's behavior in 4D space.
2. **Convex Function Properties**: The graphs validate the theoretical expectation that convex functions have a unique global minimum and increase monotonically away from it.
3. **Dimensional Independence**: The symmetry in both `x₁` and `x₂` cross-sections suggests the function's behavior is uniform across these axes, simplifying optimization tasks in this 4D space.
4. **Practical Implications**: For optimization algorithms (e.g., gradient descent), the clear minimum at the origin and smooth curvature imply efficient convergence without local minima traps.
---
### Uncertainties
- **Data Point Approximations**: Values like 12.5 or 0.5 are estimates based on grid alignment; exact values may vary by ±0.1–0.2 units.
- **Legend Consistency**: While the legend labels match the line styles, minor visual discrepancies (e.g., line thickness) were not explicitly quantified.