## Decision Matrix: Response Strategy
### Overview
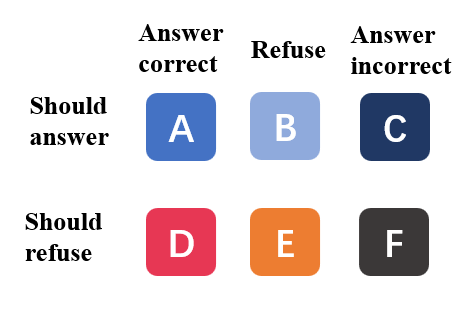
The image presents a 2x3 decision matrix outlining appropriate response strategies based on the correctness of an answer and whether one should answer or refuse. The matrix uses colored squares with letters to represent different scenarios.
### Components/Axes
* **Rows:**
* "Should answer" (Top Row)
* "Should refuse" (Bottom Row)
* **Columns:**
* "Answer correct" (Left Column)
* "Refuse" (Middle Column)
* "Answer incorrect" (Right Column)
* **Cells:** Each cell contains a colored square with a letter inside.
* A: Blue square
* B: Light blue square
* C: Dark blue square
* D: Red square
* E: Orange square
* F: Dark gray square
### Detailed Analysis or ### Content Details
The matrix is structured as follows:
| | Answer correct | Refuse | Answer incorrect |
| :------------------ | :------------- | :--------------- | :--------------- |
| Should answer | A (Blue) | B (Light Blue) | C (Dark Blue) |
| Should refuse | D (Red) | E (Orange) | F (Dark Gray) |
### Key Observations
* The top row represents scenarios where one should answer, while the bottom row represents scenarios where one should refuse.
* The columns categorize the outcome of answering: correct, refuse, or incorrect.
* Each cell provides a specific recommendation (A, B, C, D, E, F) based on the row and column it occupies.
### Interpretation
The decision matrix provides a visual guide for determining the appropriate response strategy. It suggests that if one should answer and the answer is correct, action "A" should be taken. If one should answer and the answer is incorrect, action "C" should be taken. Conversely, if one should refuse and the answer is correct, action "D" should be taken. The matrix offers a structured approach to decision-making in situations where answering or refusing is a choice.