## Chart Type: Step-wise Loss vs Tokens(B)
### Overview
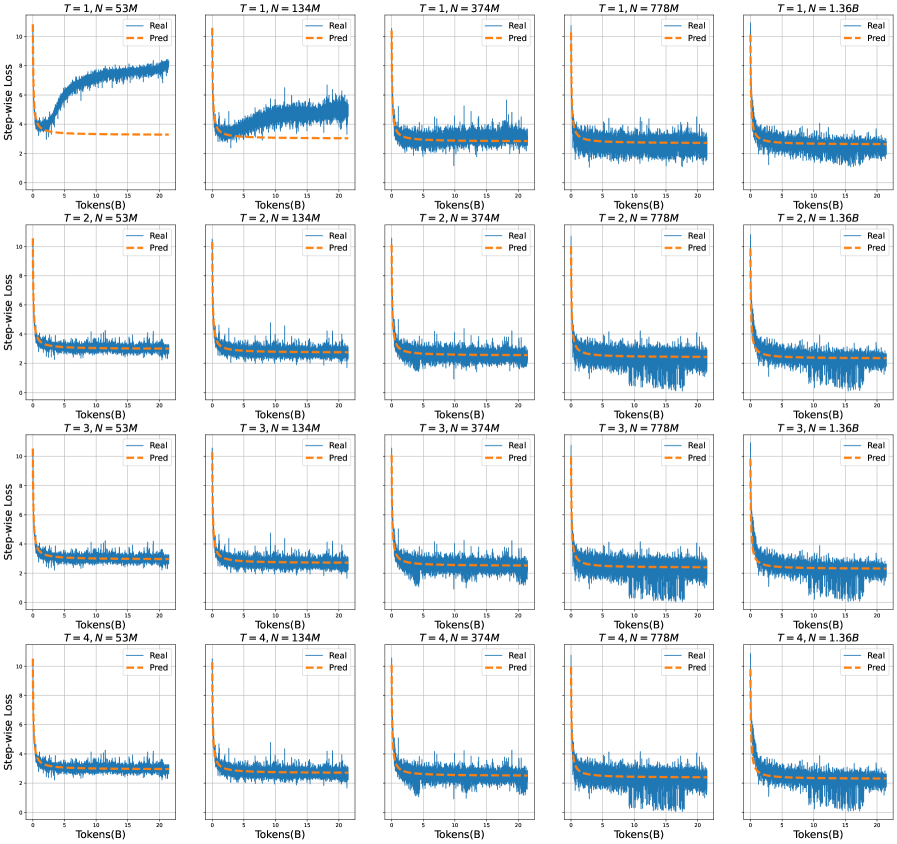
The image presents a series of line charts arranged in a 4x5 grid. Each chart displays the "Step-wise Loss" as a function of "Tokens(B)". The charts compare "Real" and "Pred" values, with "Real" represented by a solid blue line and "Pred" by a dashed orange line. The charts are organized by two parameters: 'T' (ranging from 1 to 4) and 'N' (53M, 134M, 374M, 778M, and 1.36B).
### Components/Axes
* **Y-axis (Step-wise Loss):** Ranges from 0 to 10.
* **X-axis (Tokens(B)):** Ranges from 0 to 20.
* **Legend:** Located in the top-right corner of each subplot. "Real" is represented by a solid blue line, and "Pred" is represented by a dashed orange line.
* **Titles:** Each subplot has a title in the format "T = [value], N = [value]". T ranges from 1 to 4, and N takes values 53M, 134M, 374M, 778M, and 1.36B.
### Detailed Analysis
**Row 1: T = 1**
* **N = 53M:** The "Real" line starts around 4 and increases to approximately 8 around Tokens(B) = 5, then stabilizes around 8. The "Pred" line is relatively flat at approximately 3.
* **N = 134M:** The "Real" line starts around 2, fluctuates, and stabilizes around 2. The "Pred" line starts around 8 and decreases rapidly to approximately 2.
* **N = 374M:** The "Real" line fluctuates around 1. The "Pred" line starts around 6 and decreases rapidly to approximately 1.
* **N = 778M:** The "Real" line fluctuates around 1. The "Pred" line starts around 4 and decreases rapidly to approximately 1.
* **N = 1.36B:** The "Real" line fluctuates around 1. The "Pred" line starts around 3 and decreases rapidly to approximately 1.
**Row 2: T = 2**
* **N = 53M:** The "Real" line fluctuates around 4. The "Pred" line is relatively flat at approximately 4.
* **N = 134M:** The "Real" line fluctuates around 2. The "Pred" line starts around 6 and decreases rapidly to approximately 2.
* **N = 374M:** The "Real" line fluctuates around 1. The "Pred" line starts around 4 and decreases rapidly to approximately 1.
* **N = 778M:** The "Real" line fluctuates around 1. The "Pred" line starts around 3 and decreases rapidly to approximately 1.
* **N = 1.36B:** The "Real" line fluctuates around 1. The "Pred" line starts around 2 and decreases rapidly to approximately 1.
**Row 3: T = 3**
* **N = 53M:** The "Real" line fluctuates around 4. The "Pred" line is relatively flat at approximately 4.
* **N = 134M:** The "Real" line fluctuates around 2. The "Pred" line starts around 5 and decreases rapidly to approximately 2.
* **N = 374M:** The "Real" line fluctuates around 1. The "Pred" line starts around 3 and decreases rapidly to approximately 1.
* **N = 778M:** The "Real" line fluctuates around 1. The "Pred" line starts around 2 and decreases rapidly to approximately 1.
* **N = 1.36B:** The "Real" line fluctuates around 1. The "Pred" line starts around 2 and decreases rapidly to approximately 1.
**Row 4: T = 4**
* **N = 53M:** The "Real" line fluctuates around 4. The "Pred" line is relatively flat at approximately 4.
* **N = 134M:** The "Real" line fluctuates around 2. The "Pred" line starts around 4 and decreases rapidly to approximately 2.
* **N = 374M:** The "Real" line fluctuates around 1. The "Pred" line starts around 2 and decreases rapidly to approximately 1.
* **N = 778M:** The "Real" line fluctuates around 1. The "Pred" line starts around 2 and decreases rapidly to approximately 1.
* **N = 1.36B:** The "Real" line fluctuates around 1. The "Pred" line starts around 2 and decreases rapidly to approximately 1.
### Key Observations
* As 'N' increases (53M to 1.36B), the initial "Step-wise Loss" of the "Pred" line decreases.
* For N > 53M, the "Pred" line consistently decreases rapidly to converge with the "Real" line.
* The "Real" line generally fluctuates around a lower value as 'N' increases.
* For a given 'N', the "Real" line remains relatively stable across different values of 'T'.
* When N = 53M, the "Pred" line remains relatively flat, while for other values of N, the "Pred" line decreases rapidly.
### Interpretation
The charts illustrate the convergence of predicted ("Pred") and real ("Real") step-wise loss values as the number of tokens ('N') increases. The rapid decrease in the "Pred" line suggests that the model learns more effectively with a larger number of tokens. The stability of the "Real" line across different 'T' values indicates that the real loss is consistent regardless of the 'T' parameter. The initial high loss of the "Pred" line for smaller 'N' values suggests that the model initially struggles to predict accurately with limited data, but quickly improves as 'N' increases. The case where N=53M is an outlier, where the "Pred" line does not converge to the "Real" line, suggesting that the model does not learn effectively with this small number of tokens.