TECHNICAL ASSET FINGERPRINT
975e1f4fae8484d0b800497e
Click to view fullscreen
Press ESC or click to close
FOUND IN PAPERS
EXPERT: gemma-3-27b-it-free VERSION 1
RUNTIME: google-free/gemma-3-27b-it
INTEL_VERIFIED
## Chart: Step-wise Loss vs. Tokens for Different T and N Values
### Overview
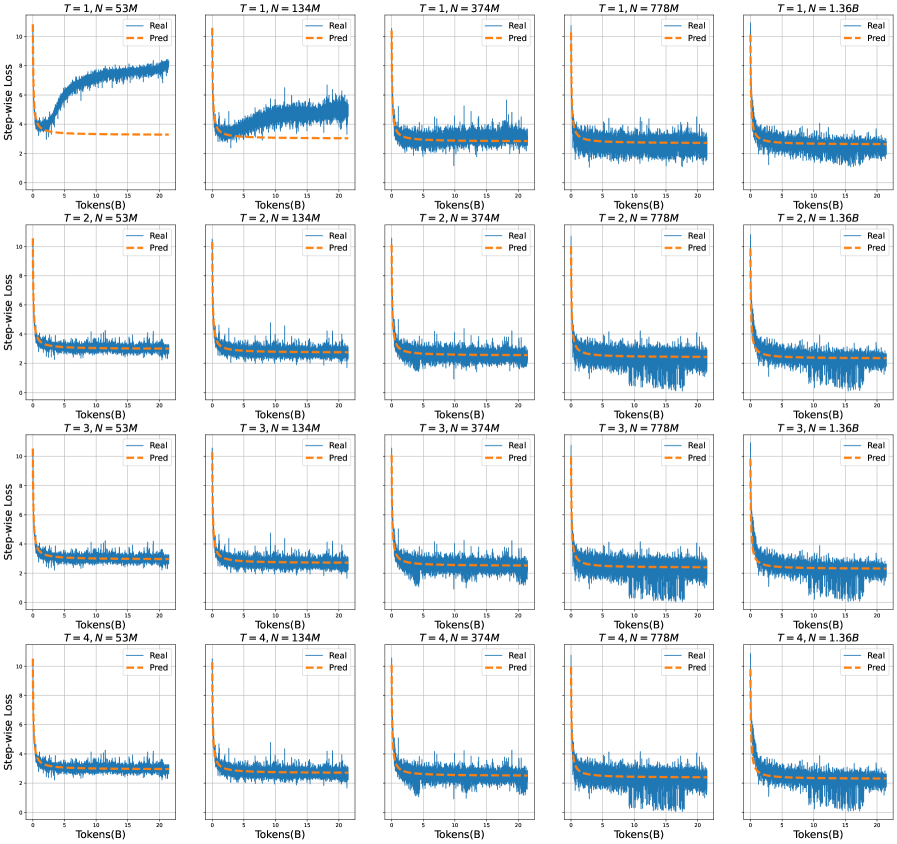
The image presents a 4x5 grid of line charts, each depicting the relationship between "Step-wise Loss" (y-axis) and "Tokens(B)" (x-axis). Each chart corresponds to a unique combination of parameters "T" and "N", indicated in the chart title. Two lines are plotted on each chart: "Real" (solid blue line) and "Pred" (dashed orange line). The charts appear to be evaluating the performance of a model, likely a language model, by comparing its predicted loss to the actual loss as the number of tokens processed increases.
### Components/Axes
* **X-axis:** "Tokens(B)" - Represents the number of tokens processed, ranging from approximately 0 to 24.
* **Y-axis:** "Step-wise Loss" - Represents the loss value, ranging from approximately 0 to 10.
* **Lines:**
* "Real" (Solid Blue Line): Represents the actual step-wise loss.
* "Pred" (Dashed Orange Line): Represents the predicted step-wise loss.
* **Titles:** Each chart has a title in the format "T = [value], N = [value]", where:
* T = 1, 2, 3, 4
* N = 53M, 134M, 374M, 778M, 1.36B
* **Legend:** Located in the top-left corner of each chart, indicating "Real" and "Pred" with corresponding colors.
### Detailed Analysis or Content Details
Here's a breakdown of the data for each chart, noting trends and approximate values. Due to the resolution, values are approximate.
**Row 1 (T=1):**
* **T = 1, N = 53M:** The "Real" line starts around 8 and decreases to approximately 1.5. The "Pred" line starts around 2 and remains relatively stable around 1.5.
* **T = 1, N = 134M:** The "Real" line starts around 8 and decreases to approximately 1. The "Pred" line starts around 2 and remains relatively stable around 1.
* **T = 1, N = 374M:** The "Real" line starts around 8 and decreases to approximately 0.8. The "Pred" line starts around 2 and remains relatively stable around 0.8.
* **T = 1, N = 778M:** The "Real" line starts around 8 and decreases to approximately 0.7. The "Pred" line starts around 2 and remains relatively stable around 0.7.
* **T = 1, N = 1.36B:** The "Real" line starts around 8 and decreases to approximately 0.6. The "Pred" line starts around 2 and remains relatively stable around 0.6.
**Row 2 (T=2):**
* **T = 2, N = 53M:** The "Real" line starts around 8 and decreases to approximately 1.5. The "Pred" line starts around 2 and remains relatively stable around 1.5.
* **T = 2, N = 134M:** The "Real" line starts around 8 and decreases to approximately 1. The "Pred" line starts around 2 and remains relatively stable around 1.
* **T = 2, N = 374M:** The "Real" line starts around 8 and decreases to approximately 0.8. The "Pred" line starts around 2 and remains relatively stable around 0.8.
* **T = 2, N = 778M:** The "Real" line starts around 8 and decreases to approximately 0.7. The "Pred" line starts around 2 and remains relatively stable around 0.7.
* **T = 2, N = 1.36B:** The "Real" line starts around 8 and decreases to approximately 0.6. The "Pred" line starts around 2 and remains relatively stable around 0.6.
**Row 3 (T=3):**
* **T = 3, N = 53M:** The "Real" line starts around 8 and decreases to approximately 1.5. The "Pred" line starts around 2 and remains relatively stable around 1.5.
* **T = 3, N = 134M:** The "Real" line starts around 8 and decreases to approximately 1. The "Pred" line starts around 2 and remains relatively stable around 1.
* **T = 3, N = 374M:** The "Real" line starts around 8 and decreases to approximately 0.8. The "Pred" line starts around 2 and remains relatively stable around 0.8.
* **T = 3, N = 778M:** The "Real" line starts around 8 and decreases to approximately 0.7. The "Pred" line starts around 2 and remains relatively stable around 0.7.
* **T = 3, N = 1.36B:** The "Real" line starts around 8 and decreases to approximately 0.6. The "Pred" line starts around 2 and remains relatively stable around 0.6.
**Row 4 (T=4):**
* **T = 4, N = 53M:** The "Real" line starts around 8 and decreases to approximately 1.5. The "Pred" line starts around 2 and remains relatively stable around 1.5.
* **T = 4, N = 134M:** The "Real" line starts around 8 and decreases to approximately 1. The "Pred" line starts around 2 and remains relatively stable around 1.
* **T = 4, N = 374M:** The "Real" line starts around 8 and decreases to approximately 0.8. The "Pred" line starts around 2 and remains relatively stable around 0.8.
* **T = 4, N = 778M:** The "Real" line starts around 8 and decreases to approximately 0.7. The "Pred" line starts around 2 and remains relatively stable around 0.7.
* **T = 4, N = 1.36B:** The "Real" line starts around 8 and decreases to approximately 0.6. The "Pred" line starts around 2 and remains relatively stable around 0.6.
### Key Observations
* **General Trend:** In all charts, the "Real" loss consistently decreases as the number of tokens increases. This suggests the model is learning and improving its predictions over time.
* **Prediction Stability:** The "Pred" loss remains relatively constant across all charts, indicating a consistent prediction level.
* **N Impact:** As "N" (model size) increases, the "Real" loss generally decreases, suggesting larger models achieve lower loss values.
* **T Impact:** The value of "T" does not appear to have a significant impact on the overall trend.
* **Convergence:** The "Real" loss appears to be converging towards a lower value as "N" increases, particularly for larger values of N (778M and 1.36B).
### Interpretation
The data suggests that the model's performance (as measured by step-wise loss) improves with the number of tokens processed and, more significantly, with the model size ("N"). The consistent "Pred" loss indicates a stable prediction baseline. The decreasing "Real" loss demonstrates the model's learning capability. The lack of a strong "T" effect suggests that the parameter "T" might not be as crucial for performance as "N" in this context.
The charts likely represent the training process of a language model. The "Real" loss represents the actual error the model makes, while the "Pred" loss could be a baseline or a target loss value. The convergence of the "Real" loss towards lower values as "N" increases indicates that larger models are better at minimizing the error and achieving higher accuracy. The consistent "Pred" loss suggests that the prediction mechanism is stable and doesn't significantly change with different model sizes or token counts.
The consistent behavior across different "T" values suggests that "T" might be related to a hyperparameter that doesn't drastically affect the learning process within the observed range. Further investigation would be needed to determine the specific role of "T".
DECODING INTELLIGENCE...