# Technical Document Extraction: FreeLaw Data Analysis
## 1. Component Isolation
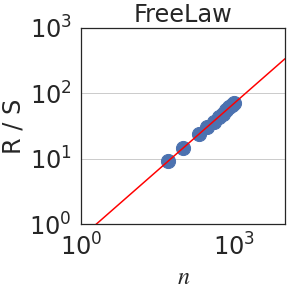
* **Header:** Contains the title "FreeLaw".
* **Main Chart Area:** A log-log scatter plot with a superimposed linear regression line.
* **Axes:**
* **Y-axis (Vertical):** Labeled "R / S" with logarithmic scaling.
* **X-axis (Horizontal):** Labeled "$n$" with logarithmic scaling.
## 2. Metadata and Labels
* **Title:** FreeLaw
* **Y-Axis Label:** R / S
* **X-Axis Label:** $n$
* **Y-Axis Scale Markers:** $10^0$ (1), $10^1$ (10), $10^2$ (100), $10^3$ (1000).
* **X-Axis Scale Markers:** $10^0$ (1), $10^3$ (1000).
## 3. Data Series Analysis
### Series 1: Observed Data Points (Scatter Plot)
* **Visual Description:** A series of large, circular blue dots.
* **Trend Verification:** The points follow a strictly upward diagonal path from the center-left toward the upper-right of the plot. The spacing between points decreases as they move toward the higher values of $n$, suggesting a higher density of data collection at larger scales.
* **Spatial Grounding:**
* The first visible data point is located at approximately $n \approx 10^{1.5}$ (approx. 30-40) and $R/S \approx 10^{0.9}$ (approx. 8-9).
* The cluster of points terminates just before $n = 10^3$ (1000), with the corresponding $R/S$ value being slightly below $10^2$ (approx. 70-80).
### Series 2: Theoretical/Fit Line (Regression)
* **Visual Description:** A solid red line.
* **Trend Verification:** The line slopes upward with a constant gradient on this log-log scale, indicating a power-law relationship between $n$ and $R/S$.
* **Spatial Grounding:**
* The line originates at the bottom left corner $(10^0, 10^0)$.
* The line passes directly through the center of the blue circular data points, indicating an extremely high correlation/goodness of fit.
* The line continues past the data points toward the top right corner, reaching $R/S \approx 10^{2.5}$ at the right edge of the frame.
## 4. Key Trends and Data Points
* **Relationship Type:** The linear appearance on a log-log plot confirms a **Power Law** relationship.
* **Correlation:** There is a near-perfect positive correlation between the variable $n$ and the ratio $R/S$.
* **Data Range:**
* **$n$ (Independent Variable):** Data is sampled from approximately $3 \times 10^1$ to $10^3$.
* **$R/S$ (Dependent Variable):** Values range from approximately $8 \times 10^0$ to $8 \times 10^1$.
* **Slope Observation:** The line appears to have a slope of approximately $0.7$ to $0.8$ (visual estimation based on the rise over run across the log cycles).
## 5. Summary of Information
This chart, titled **FreeLaw**, illustrates the scaling behavior of a system where the metric **$R/S$** is a function of **$n$**. The data points (blue circles) align precisely with a linear fit (red line) on a logarithmic scale, proving that as $n$ increases, $R/S$ increases according to a predictable power-law distribution. No significant outliers are present in the visualized range.