# Technical Document Analysis: FreeLaw Scatter Plot
## 1. **Chart Identification**
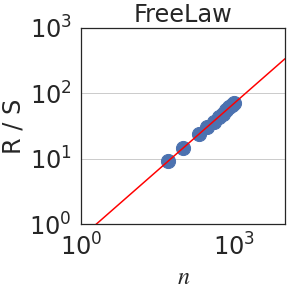
- **Type**: Scatter plot with linear trend line.
- **Title**: "FreeLaw" (centered at the top of the plot).
- **Axes**:
- **X-axis**: Labeled "n" (horizontal), logarithmic scale (10⁰ to 10³).
- **Y-axis**: Labeled "R/S" (vertical), logarithmic scale (10⁰ to 10³).
## 2. **Key Trends and Data Points**
- **Trend Line**:
- **Color**: Red.
- **Slope**: Diagonal upward (positive correlation).
- **Interpretation**: Represents a power-law relationship between `n` and `R/S` (straight line on log-log scale implies `R/S ∝ n^k` for some constant `k`).
- **Data Points**:
- **Color**: Blue dots.
- **Distribution**: Clustered around the red trend line, primarily in the range:
- `n`: 10⁰ to 10³.
- `R/S`: 10¹ to 10².
- **Notable**: Data points deviate slightly from the trend line at the extremes (e.g., lower `n` values show less consistency).
## 3. **Legend and Color Mapping**
- **Legend**: Not explicitly labeled in the plot. However:
- **Red**: Trend line (linear fit).
- **Blue**: Observed data points.
- **Spatial Grounding**: Legend inferred from color coding; no explicit box present.
## 4. **Component Isolation**
- **Header**: "FreeLaw" (title).
- **Main Chart**: Scatter plot with trend line.
- **Footer**: None visible.
## 5. **Trend Verification**
- **Visual Confirmation**: Red line slopes upward, confirming a positive relationship between `n` and `R/S`.
- **Data Alignment**: Blue dots align closely with the trend line in the mid-range (`n ≈ 10¹` to `10²`), suggesting the power-law holds most strongly here. Deviations at extremes may indicate measurement noise or model limitations.
## 6. **Axis Markers and Labels**
- **X-axis Markers**: 10⁰, 10¹, 10², 10³.
- **Y-axis Markers**: 10⁰, 10¹, 10², 10³.
- **Units**: No explicit units provided for `n` or `R/S`.
## 7. **Additional Observations**
- **Scale**: Logarithmic axes emphasize multiplicative relationships.
- **Data Density**: Higher concentration of points in the 10¹–10² range for `R/S`, suggesting commonality in this regime.
- **Outliers**: No explicit outliers; all points lie near the trend line.
## 8. **Conclusion**
The plot demonstrates a power-law scaling of `R/S` with `n` in the FreeLaw system, with the relationship most consistent in the mid-range of `n`. The logarithmic axes highlight the proportional growth rate, while deviations at extremes warrant further investigation.