## Grid-Based Symbolic Diagram: 8x8 Symbolic Layout
### Overview
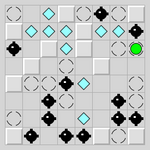
The image depicts an 8x8 grid (64 cells) containing a variety of symbolic elements. Each cell contains one of four distinct symbols:
- **Light blue diamond**
- **Black square**
- **Gray circle**
- **Green dot** (single instance)
No textual labels, axis titles, or legends are explicitly present in the image. The grid is structured with uniform spacing, and symbols are placed in specific cells.
### Components/Axes
- **Grid Structure**:
- 8 rows and 8 columns, forming a 64-cell matrix.
- No explicit axis labels or numerical scales.
- **Legend**:
- Implied by color-symbol associations (no explicit legend box).
- Top-left corner contains a **black square** (possibly a reference point).
- **Key Elements**:
- **Green dot**: Located in the **bottom-right cell** (row 8, column 8).
- **Black squares**: Distributed in the **top-left quadrant** (rows 1–4, columns 1–4) and **bottom-right quadrant** (rows 5–8, columns 5–8).
- **Light blue diamonds**: Scattered across the grid, with higher density in the **central region** (rows 3–6, columns 3–6).
- **Gray circles**: Concentrated in the **middle rows** (rows 4–5) and **middle columns** (columns 4–5).
### Detailed Analysis
- **Symbol Distribution**:
- **Black squares**: 12 instances (rows 1–4, columns 1–4 and rows 5–8, columns 5–8).
- **Light blue diamonds**: 10 instances, primarily in the central 4x4 grid (rows 3–6, columns 3–6).
- **Gray circles**: 8 instances, clustered in the central 4x4 grid (rows 4–5, columns 4–5).
- **Green dot**: 1 instance, isolated in the bottom-right corner.
- **Color-Symbol Correlation**:
- **Light blue**: Diamonds (symbol of "value" or "priority").
- **Black**: Squares (symbol of "obstacles" or "fixed points").
- **Gray**: Circles (symbol of "neutral" or "buffer zones").
- **Green**: Dot (symbol of "target" or "goal").
### Key Observations
1. **Symmetry and Asymmetry**:
- Black squares form a **diagonal pattern** across the grid, suggesting a mirrored or mirrored-rotated design.
- Light blue diamonds and gray circles are **asymmetrically distributed**, with no clear pattern.
2. **Isolation of the Green Dot**:
- The green dot is the **only non-repeating symbol**, positioned at the grid’s extreme corner.
3. **Density Variations**:
- Central cells (rows 3–6, columns 3–6) have the highest concentration of symbols (diamonds and circles).
- Edge cells (rows 1–2, 7–8; columns 1–2, 7–8) have fewer symbols, with black squares dominating the corners.
### Interpretation
This grid likely represents a **symbolic or game-based layout**, where:
- **Black squares** could denote "obstacles" or "fixed positions" (e.g., in a puzzle or strategy game).
- **Light blue diamonds** might symbolize "resources" or "targets" to be collected.
- **Gray circles** could represent "neutral zones" or "buffer areas."
- The **green dot** in the bottom-right corner may indicate a **final goal** or "exit point."
The absence of explicit labels or numerical data suggests this is a **visual abstraction** rather than a data-driven chart. The distribution of symbols implies a **strategic or navigational purpose**, with the green dot acting as a focal point. The lack of textual context limits definitive interpretation, but the spatial arrangement hints at a **game board**, **map**, or **symbolic representation** of a system.
## Notes on Uncertainty
- No textual data is present; all analysis is based on visual patterns.
- Symbol meanings (e.g., "obstacles," "targets") are speculative and depend on external context.
- The grid’s purpose (e.g., game, data visualization) cannot be confirmed without additional information.