## Histogram: Length of Reasoning Chains in Tokens
### Overview
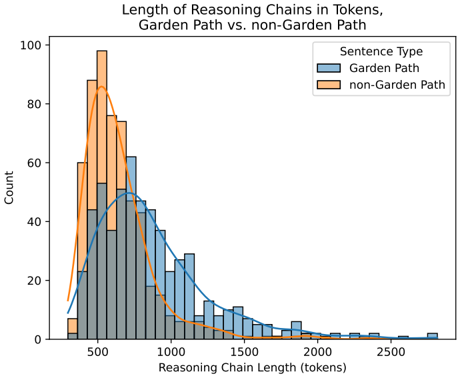
The image is a histogram comparing the distribution of reasoning chain lengths (in tokens) for "Garden Path" and "non-Garden Path" sentence types. The x-axis represents the reasoning chain length in tokens, and the y-axis represents the count of occurrences. The histogram includes overlaid curves representing the estimated probability density for each sentence type.
### Components/Axes
* **Title:** Length of Reasoning Chains in Tokens, Garden Path vs. non-Garden Path
* **X-axis:** Reasoning Chain Length (tokens)
* Scale: 0 to 2500, with visible markers at approximately 500, 1000, 1500, 2000, and 2500.
* **Y-axis:** Count
* Scale: 0 to 100, with markers every 20 units.
* **Legend:** Located in the top-right corner.
* "Sentence Type"
* Blue: Garden Path
* Orange: non-Garden Path
### Detailed Analysis
* **Garden Path (Blue):**
* The histogram bars are light blue with dark blue outlines.
* The overlaid curve is blue.
* The distribution appears roughly normal, centered around 800 tokens.
* The count is approximately:
* 50 at 400 tokens
* 50 at 800 tokens
* 20 at 1200 tokens
* 5 at 1600 tokens
* 2 at 2000 tokens
* 1 at 2400 tokens
* **Non-Garden Path (Orange):**
* The histogram bars are light orange with dark orange outlines.
* The overlaid curve is orange.
* The distribution is skewed right, with a peak around 400 tokens.
* The count is approximately:
* 8 at 200 tokens
* 95 at 400 tokens
* 45 at 600 tokens
* 10 at 800 tokens
* 2 at 1000 tokens
* 1 at 1200 tokens
### Key Observations
* The "non-Garden Path" sentences tend to have shorter reasoning chains compared to "Garden Path" sentences.
* The distribution of "non-Garden Path" reasoning chain lengths is more concentrated, with a sharp peak at lower token counts.
* The distribution of "Garden Path" reasoning chain lengths is more spread out, with a longer tail extending to higher token counts.
### Interpretation
The histogram suggests that "non-Garden Path" sentences require shorter reasoning chains, indicating they might be simpler or more direct in their logical structure. "Garden Path" sentences, on the other hand, seem to involve more complex or extended reasoning processes, as reflected in the longer reasoning chain lengths. The difference in distributions could be related to the cognitive effort required to process each type of sentence, with "Garden Path" sentences potentially requiring more backtracking or re-evaluation of initial interpretations. The data suggests that the model needs to perform more steps to arrive at the correct interpretation for "Garden Path" sentences.