## Bar Chart: Avg. ROUGE-L F1 vs. Training Tokens
### Overview
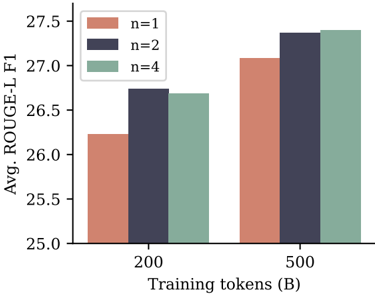
The image is a bar chart comparing the average ROUGE-L F1 score for different values of 'n' (1, 2, and 4) against the number of training tokens (200 and 500). The chart shows how the ROUGE-L F1 score changes with different 'n' values and training token sizes.
### Components/Axes
* **Y-axis:** Avg. ROUGE-L F1, ranging from 25.0 to 27.5 in increments of 0.5.
* **X-axis:** Training tokens (B), with two values: 200 and 500.
* **Legend:** Located in the top-left corner, indicating the 'n' values:
* n=1 (salmon color)
* n=2 (dark gray color)
* n=4 (light green color)
### Detailed Analysis
* **Training Tokens (200):**
* n=1 (salmon): Avg. ROUGE-L F1 ≈ 26.2
* n=2 (dark gray): Avg. ROUGE-L F1 ≈ 26.7
* n=4 (light green): Avg. ROUGE-L F1 ≈ 26.7
* **Training Tokens (500):**
* n=1 (salmon): Avg. ROUGE-L F1 ≈ 27.1
* n=2 (dark gray): Avg. ROUGE-L F1 ≈ 27.4
* n=4 (light green): Avg. ROUGE-L F1 ≈ 27.4
### Key Observations
* For both 200 and 500 training tokens, n=2 and n=4 have similar ROUGE-L F1 scores, which are higher than n=1.
* Increasing the number of training tokens from 200 to 500 improves the ROUGE-L F1 score for all values of 'n'.
* The improvement in ROUGE-L F1 score is more significant for n=1 when increasing training tokens from 200 to 500.
### Interpretation
The chart suggests that increasing the number of training tokens generally improves the ROUGE-L F1 score. The values n=2 and n=4 perform similarly and better than n=1. This indicates that using higher order n-grams (n=2, 4) in the ROUGE-L evaluation metric results in better performance compared to using unigrams (n=1). The improvement observed when increasing training tokens from 200 to 500 suggests that more data leads to better model performance, as expected. The similar performance of n=2 and n=4 might indicate a saturation point where increasing 'n' beyond 2 does not significantly improve the ROUGE-L F1 score.