## Bar Chart: ROUGE-L F1 Score vs. Training Tokens and N-gram Size
### Overview
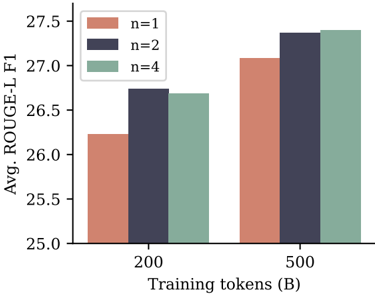
The image is a grouped bar chart comparing the average ROUGE-L F1 score (a metric for evaluating text summarization or generation quality) across two different amounts of training data and three different n-gram settings. The chart demonstrates how model performance scales with increased training data and changes with the n-gram parameter.
### Components/Axes
* **Chart Type:** Grouped Bar Chart.
* **Y-Axis:**
* **Label:** "Avg. ROUGE-L F1"
* **Scale:** Linear, ranging from 25.0 to 27.5, with major tick marks every 0.5 units (25.0, 25.5, 26.0, 26.5, 27.0, 27.5).
* **X-Axis:**
* **Label:** "Training tokens (B)" (B denotes Billions).
* **Categories:** Two discrete categories: "200" and "500".
* **Legend:**
* **Position:** Top-left corner of the plot area.
* **Labels & Colors:**
* `n=1`: Salmon/light red color.
* `n=2`: Dark blue/indigo color.
* `n=4`: Sage green/gray-green color.
* **Data Series:** Three series (n=1, n=2, n=4) are plotted for each of the two x-axis categories (200B, 500B tokens), resulting in six total bars.
### Detailed Analysis
The chart presents the following approximate data points, read from the y-axis scale:
**For 200 Billion Training Tokens:**
* **n=1 (Salmon bar):** The bar height is approximately **26.2**.
* **n=2 (Dark blue bar):** The bar height is approximately **26.7**.
* **n=4 (Sage green bar):** The bar height is approximately **26.7**. It appears visually identical in height to the n=2 bar.
**For 500 Billion Training Tokens:**
* **n=1 (Salmon bar):** The bar height is approximately **27.1**.
* **n=2 (Dark blue bar):** The bar height is approximately **27.4**.
* **n=4 (Sage green bar):** The bar height is approximately **27.4**. It appears visually identical in height to the n=2 bar.
**Visual Trend Verification:**
* **Trend 1 (Data Scaling):** For all three n-gram settings (n=1, n=2, n=4), the bars for 500B tokens are taller than their counterparts for 200B tokens. This indicates a clear **upward trend** in ROUGE-L F1 score as the amount of training data increases from 200B to 500B tokens.
* **Trend 2 (N-gram Comparison):** Within each training data group (200B and 500B), the n=1 bar is the shortest. The n=2 and n=4 bars are taller and appear to be of equal height. This suggests that using bigrams (n=2) or 4-grams (n=4) yields a higher score than using unigrams (n=1), but there is no discernible difference in performance between n=2 and n=4 in this visualization.
### Key Observations
1. **Performance Gain from Data:** Increasing training tokens from 200B to 500B results in a consistent performance boost of approximately **0.9 points** for n=1 and **0.7 points** for both n=2 and n=4.
2. **N-gram Impact Plateau:** The performance difference between using n=2 and n=4 is negligible or non-existent in this chart. The primary performance jump occurs when moving from n=1 to n=2.
3. **Relative Performance Hierarchy:** The hierarchy of performance is consistent across both data scales: `n=2 ≈ n=4 > n=1`.
### Interpretation
This chart illustrates two key findings relevant to training text generation or summarization models:
1. **Data Scaling is Effective:** The model's output quality, as measured by ROUGE-L F1, improves with more training data. This is a fundamental and expected result in machine learning, confirming that the model benefits from exposure to a larger corpus.
2. **Diminishing Returns on N-gram Complexity:** While incorporating higher-order n-gram information (moving from unigrams to bigrams) provides a clear benefit, further increasing the n-gram order to 4 does not yield additional gains in this specific metric and experimental setup. This could suggest that the additional contextual information from 4-grams is either not captured effectively by the ROUGE-L metric, is redundant with the information captured by bigrams for this task, or requires a different model architecture or training approach to leverage.
The data implies that for this particular task and evaluation, optimizing for bigram (n=2) matching is sufficient to achieve peak performance as measured by ROUGE-L, and resources might be better allocated to acquiring more training data rather than increasing n-gram complexity beyond that point.