## Bar Chart: Average ROUGE-L F1 Scores by Training Tokens and n Values
### Overview
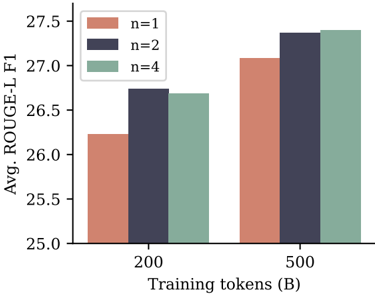
The chart compares average ROUGE-L F1 scores across three configurations (n=1, n=2, n=4) for two training token quantities (200B and 500B). The y-axis shows performance metrics, while the x-axis represents training token scale. Three color-coded bars per token quantity visualize performance differences.
### Components/Axes
- **X-axis**: "Training tokens (B)" with categories 200 and 500
- **Y-axis**: "Avg. ROUGE-L F1" scaled from 25.0 to 27.5
- **Legend**:
- Red = n=1
- Blue = n=2
- Green = n=4
- **Bar Colors**:
- Red (n=1) bars are consistently shortest
- Blue (n=2) bars show intermediate values
- Green (n=4) bars are tallest
### Detailed Analysis
- **200B Training Tokens**:
- n=1: ~26.2 (red)
- n=2: ~26.7 (blue)
- n=4: ~26.6 (green)
- **500B Training Tokens**:
- n=1: ~27.1 (red)
- n=2: ~27.4 (blue)
- n=4: ~27.5 (green)
### Key Observations
1. **Performance Scaling**: All configurations show improved performance with increased training tokens (200B → 500B)
2. **n=4 Dominance**: Green bars (n=4) consistently outperform others by 0.3-0.4 F1 points across both token quantities
3. **n=2 Advantage**: Blue bars (n=2) outperform n=1 by 0.5-0.6 F1 points
4. **Diminishing Returns**: The performance gap between n=2 and n=4 narrows at 500B tokens (0.1 vs 0.3 at 200B)
### Interpretation
The data demonstrates that:
- Larger training token quantities (500B) improve model performance across all configurations
- Increasing the number of training instances (n) has a stronger impact than token quantity alone
- The n=4 configuration achieves near-maximum performance (27.5 F1) at 500B tokens, suggesting diminishing returns beyond this point
- The performance hierarchy (n=4 > n=2 > n=1) remains consistent regardless of token quantity, indicating configuration efficiency matters more than scale in this context
The chart suggests optimizing for higher n values when training token quantities are fixed, with 500B tokens providing the best balance between resource use and performance gains.