## Line Chart: Llama3-8B-Chat Loss vs. Epoch
### Overview
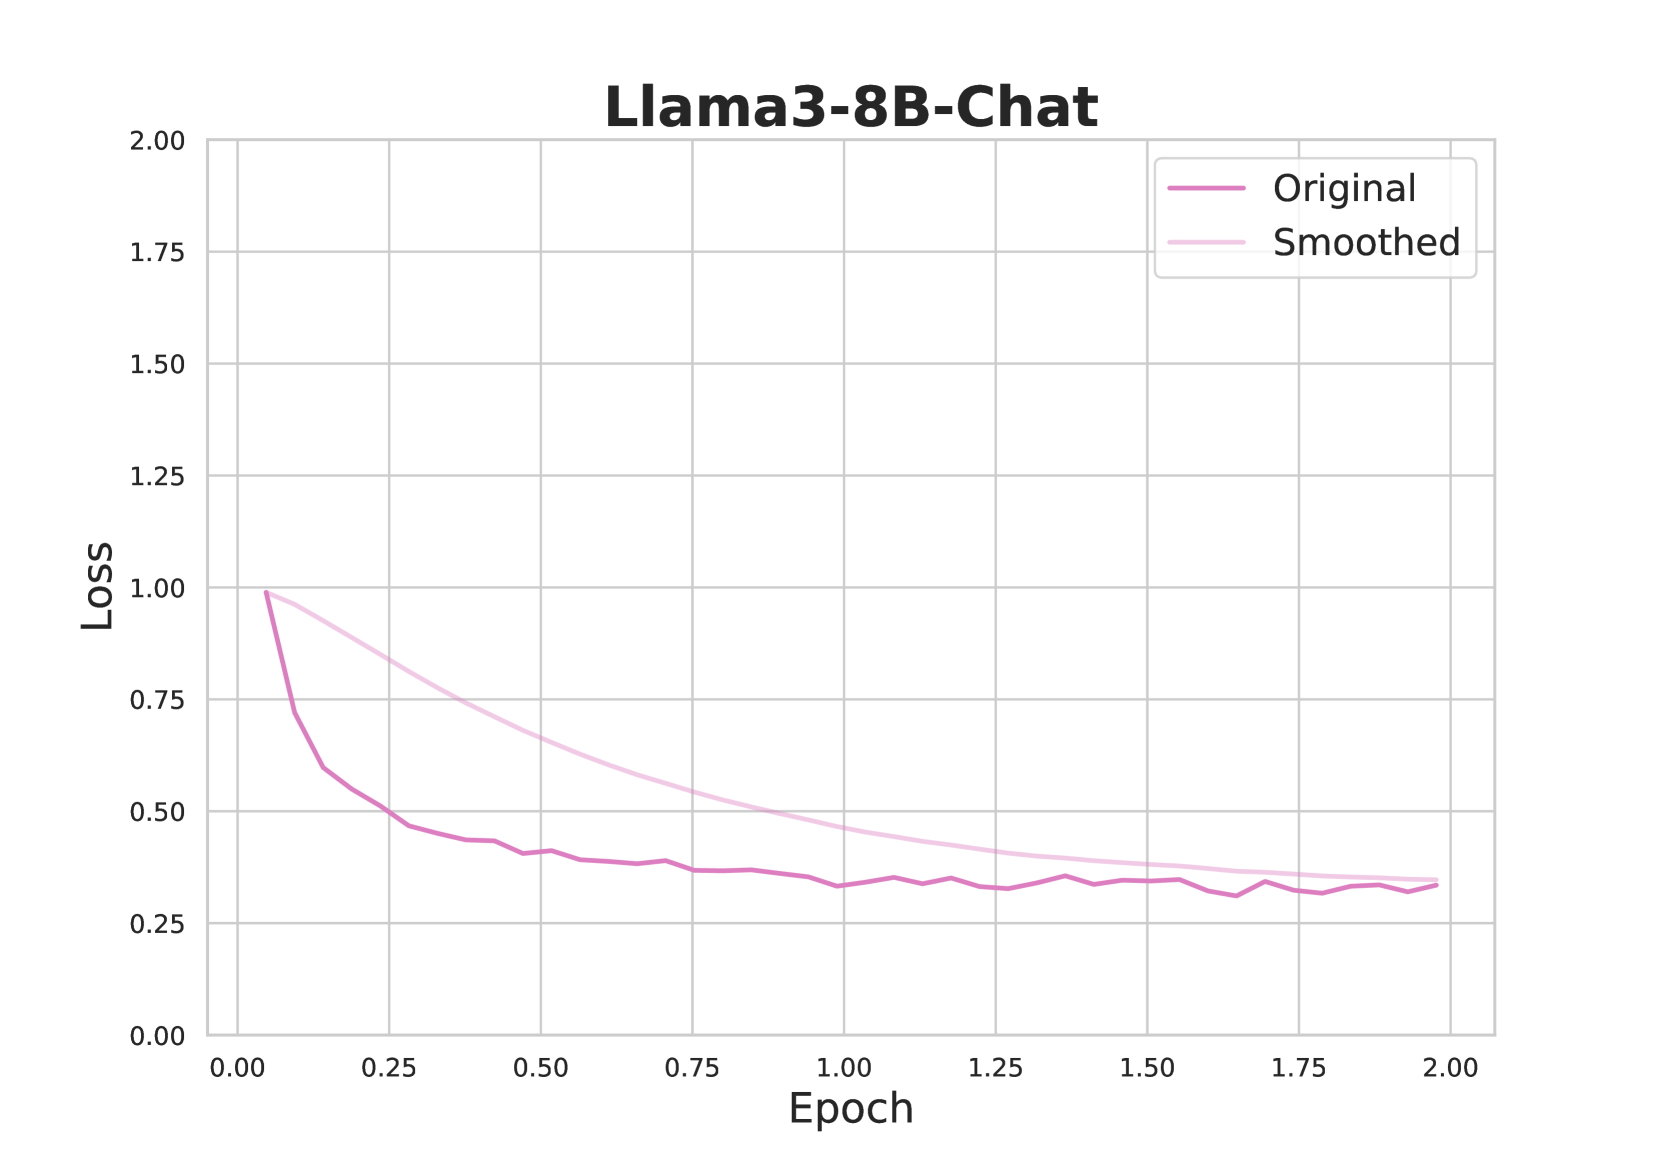
The image is a line chart displaying the loss of the Llama3-8B-Chat model during training as a function of the epoch. Two lines are plotted: the "Original" loss and the "Smoothed" loss. The chart shows how the loss decreases over epochs, indicating the model is learning.
### Components/Axes
* **Title:** Llama3-8B-Chat
* **X-axis:** Epoch, ranging from 0.00 to 2.00 in increments of 0.25.
* **Y-axis:** Loss, ranging from 0.00 to 2.00 in increments of 0.25.
* **Legend:** Located in the top-right corner.
* "Original": Represented by a solid medium-purple line.
* "Smoothed": Represented by a light-purple line.
### Detailed Analysis
* **Original Loss (Medium-Purple Line):**
* Trend: The original loss decreases rapidly in the initial epochs and then plateaus.
* Data Points:
* Epoch 0.00: Loss approximately 1.00
* Epoch 0.25: Loss approximately 0.55
* Epoch 0.50: Loss approximately 0.43
* Epoch 0.75: Loss approximately 0.40
* Epoch 1.00: Loss approximately 0.37
* Epoch 1.25: Loss approximately 0.34
* Epoch 1.50: Loss approximately 0.33
* Epoch 1.75: Loss approximately 0.33
* Epoch 2.00: Loss approximately 0.33
* **Smoothed Loss (Light-Purple Line):**
* Trend: The smoothed loss also decreases, but more gradually than the original loss.
* Data Points:
* Epoch 0.00: Loss approximately 1.00
* Epoch 0.25: Loss approximately 0.85
* Epoch 0.50: Loss approximately 0.70
* Epoch 0.75: Loss approximately 0.60
* Epoch 1.00: Loss approximately 0.52
* Epoch 1.25: Loss approximately 0.47
* Epoch 1.50: Loss approximately 0.43
* Epoch 1.75: Loss approximately 0.39
* Epoch 2.00: Loss approximately 0.35
### Key Observations
* The "Original" loss fluctuates more than the "Smoothed" loss, as expected.
* Both lines converge to a similar loss value (approximately 0.33-0.35) by the end of the training period (2.00 epochs).
* The most significant decrease in loss occurs within the first 0.5 epochs.
### Interpretation
The chart illustrates the training progress of the Llama3-8B-Chat model. The decreasing loss indicates that the model is learning and improving its performance over time. The "Smoothed" loss provides a clearer picture of the overall trend by averaging out the fluctuations in the "Original" loss. The convergence of both lines suggests that the model has reached a stable state, where further training may not significantly reduce the loss. The rapid initial decrease in loss indicates that the model quickly learns the most important patterns in the data, while subsequent epochs result in diminishing returns.