## Line Chart: Llama3-8B-Chat Loss vs. Epoch
### Overview
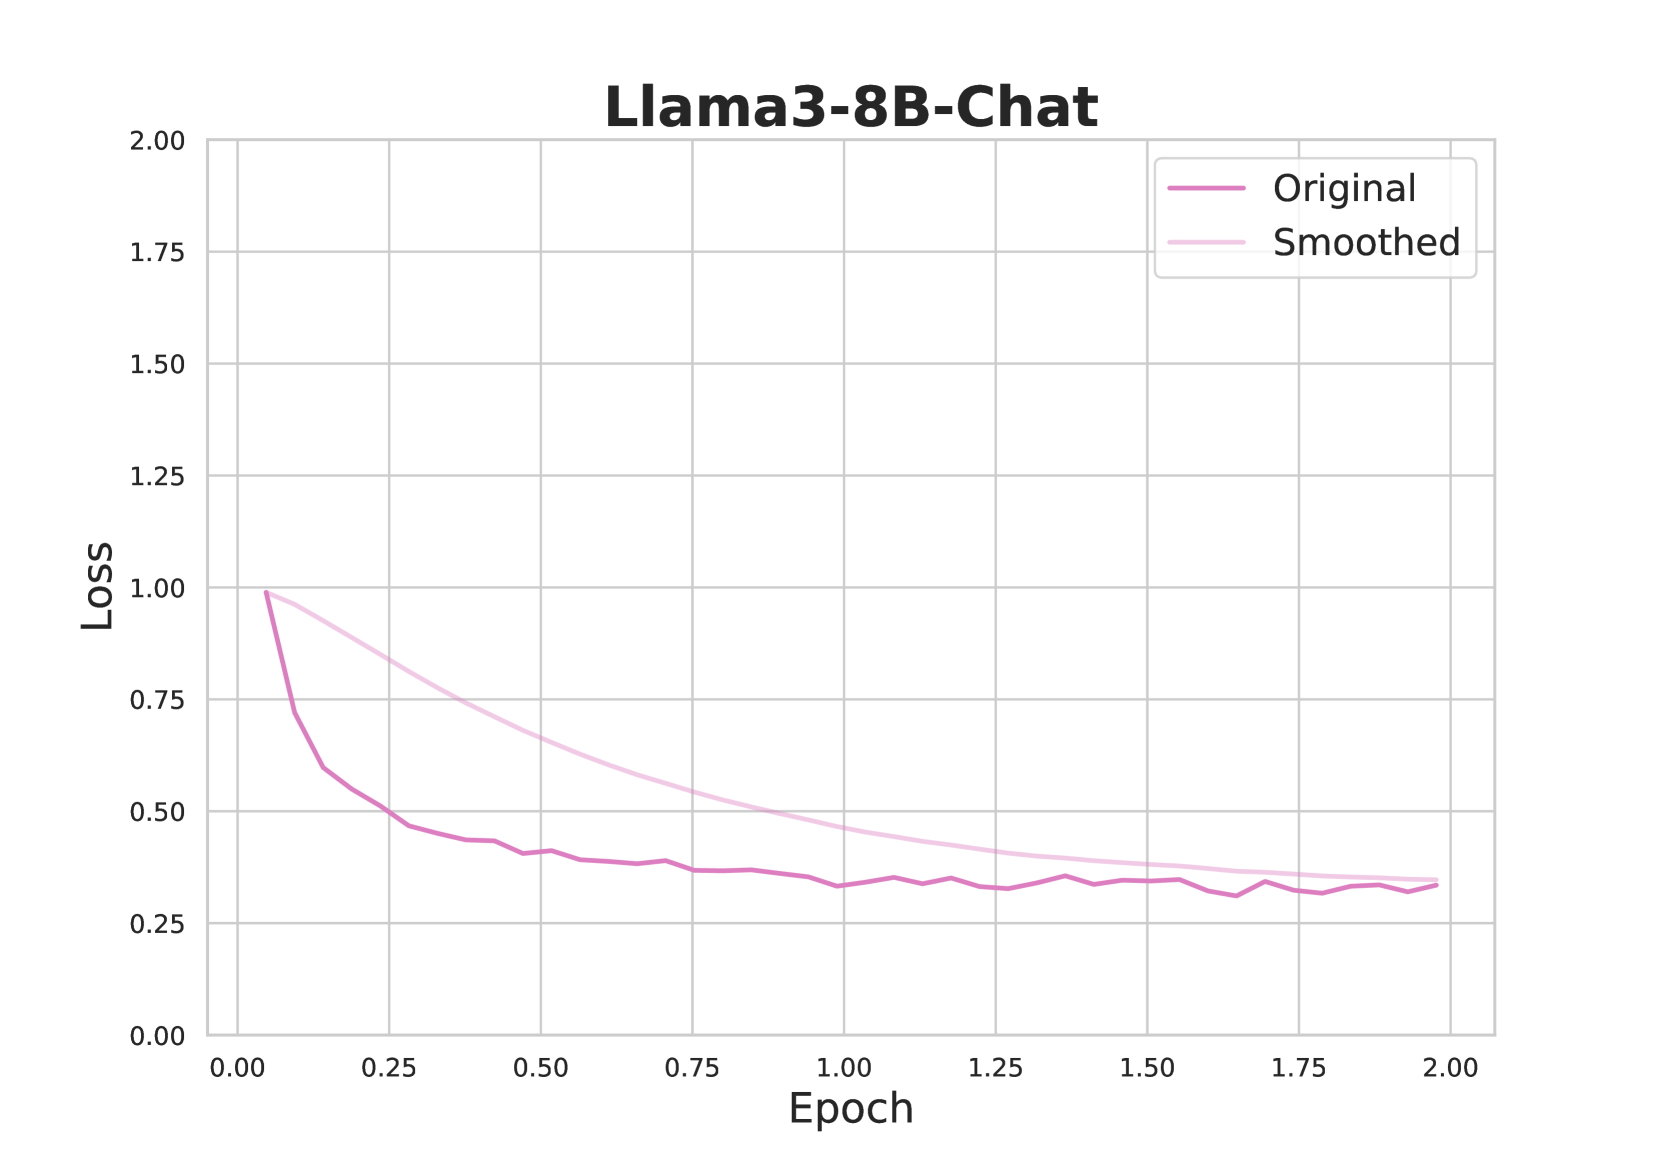
This chart displays the loss function of a Llama3-8B-Chat model over epochs. Two lines are plotted: the original loss and a smoothed version of the loss. The chart aims to visualize the model's training progress and stability.
### Components/Axes
* **Title:** Llama3-8B-Chat (positioned top-center)
* **X-axis:** Epoch (ranging from approximately 0.00 to 2.00, with tick marks at 0.25 intervals)
* **Y-axis:** Loss (ranging from approximately 0.00 to 2.00, with tick marks at 0.25 intervals)
* **Legend:** Located in the top-right corner.
* "Original" - represented by a purple line.
* "Smoothed" - represented by a pink line.
### Detailed Analysis
The chart shows two lines representing loss over epochs.
**Original Loss (Purple Line):**
The line starts at approximately 0.95 at Epoch 0.00. It exhibits a steep downward trend until approximately Epoch 0.50, reaching a minimum loss of around 0.40. From Epoch 0.50 to Epoch 2.00, the line fluctuates between approximately 0.25 and 0.40, showing some oscillation but generally remaining relatively stable. Specific data points (approximate):
* Epoch 0.00: Loss = 0.95
* Epoch 0.25: Loss = 0.70
* Epoch 0.50: Loss = 0.40
* Epoch 0.75: Loss = 0.35
* Epoch 1.00: Loss = 0.30
* Epoch 1.25: Loss = 0.32
* Epoch 1.50: Loss = 0.28
* Epoch 1.75: Loss = 0.35
* Epoch 2.00: Loss = 0.30
**Smoothed Loss (Pink Line):**
The smoothed line also starts at approximately 0.95 at Epoch 0.00. It shows a similar downward trend to the original line, but it is less steep and more consistent. The smoothed line reaches a minimum loss of around 0.25 at approximately Epoch 1.00. From Epoch 1.00 to Epoch 2.00, the smoothed line remains relatively stable, fluctuating between approximately 0.25 and 0.30. Specific data points (approximate):
* Epoch 0.00: Loss = 0.95
* Epoch 0.25: Loss = 0.65
* Epoch 0.50: Loss = 0.45
* Epoch 0.75: Loss = 0.35
* Epoch 1.00: Loss = 0.25
* Epoch 1.25: Loss = 0.28
* Epoch 1.50: Loss = 0.27
* Epoch 1.75: Loss = 0.29
* Epoch 2.00: Loss = 0.30
### Key Observations
* Both the original and smoothed loss curves demonstrate a decreasing trend, indicating that the model is learning and improving over epochs.
* The smoothed line is less noisy than the original line, suggesting that it provides a more stable representation of the model's learning progress.
* The loss appears to converge after approximately Epoch 0.50, with both lines fluctuating around a relatively low loss value.
* The difference between the original and smoothed lines is minimal, indicating that the smoothing process does not significantly alter the overall trend.
### Interpretation
The chart suggests that the Llama3-8B-Chat model is successfully training, as evidenced by the decreasing loss function. The smoothing of the loss curve helps to visualize the underlying trend and reduce the impact of noise. The convergence of the loss after a certain number of epochs indicates that the model has reached a stable state and further training may not yield significant improvements. The relatively small difference between the original and smoothed loss curves suggests that the model's learning process is consistent and predictable. The data suggests that the model is learning effectively and efficiently, and that the training process is stable and well-behaved. The model appears to have converged to a good solution, as indicated by the low and stable loss values.