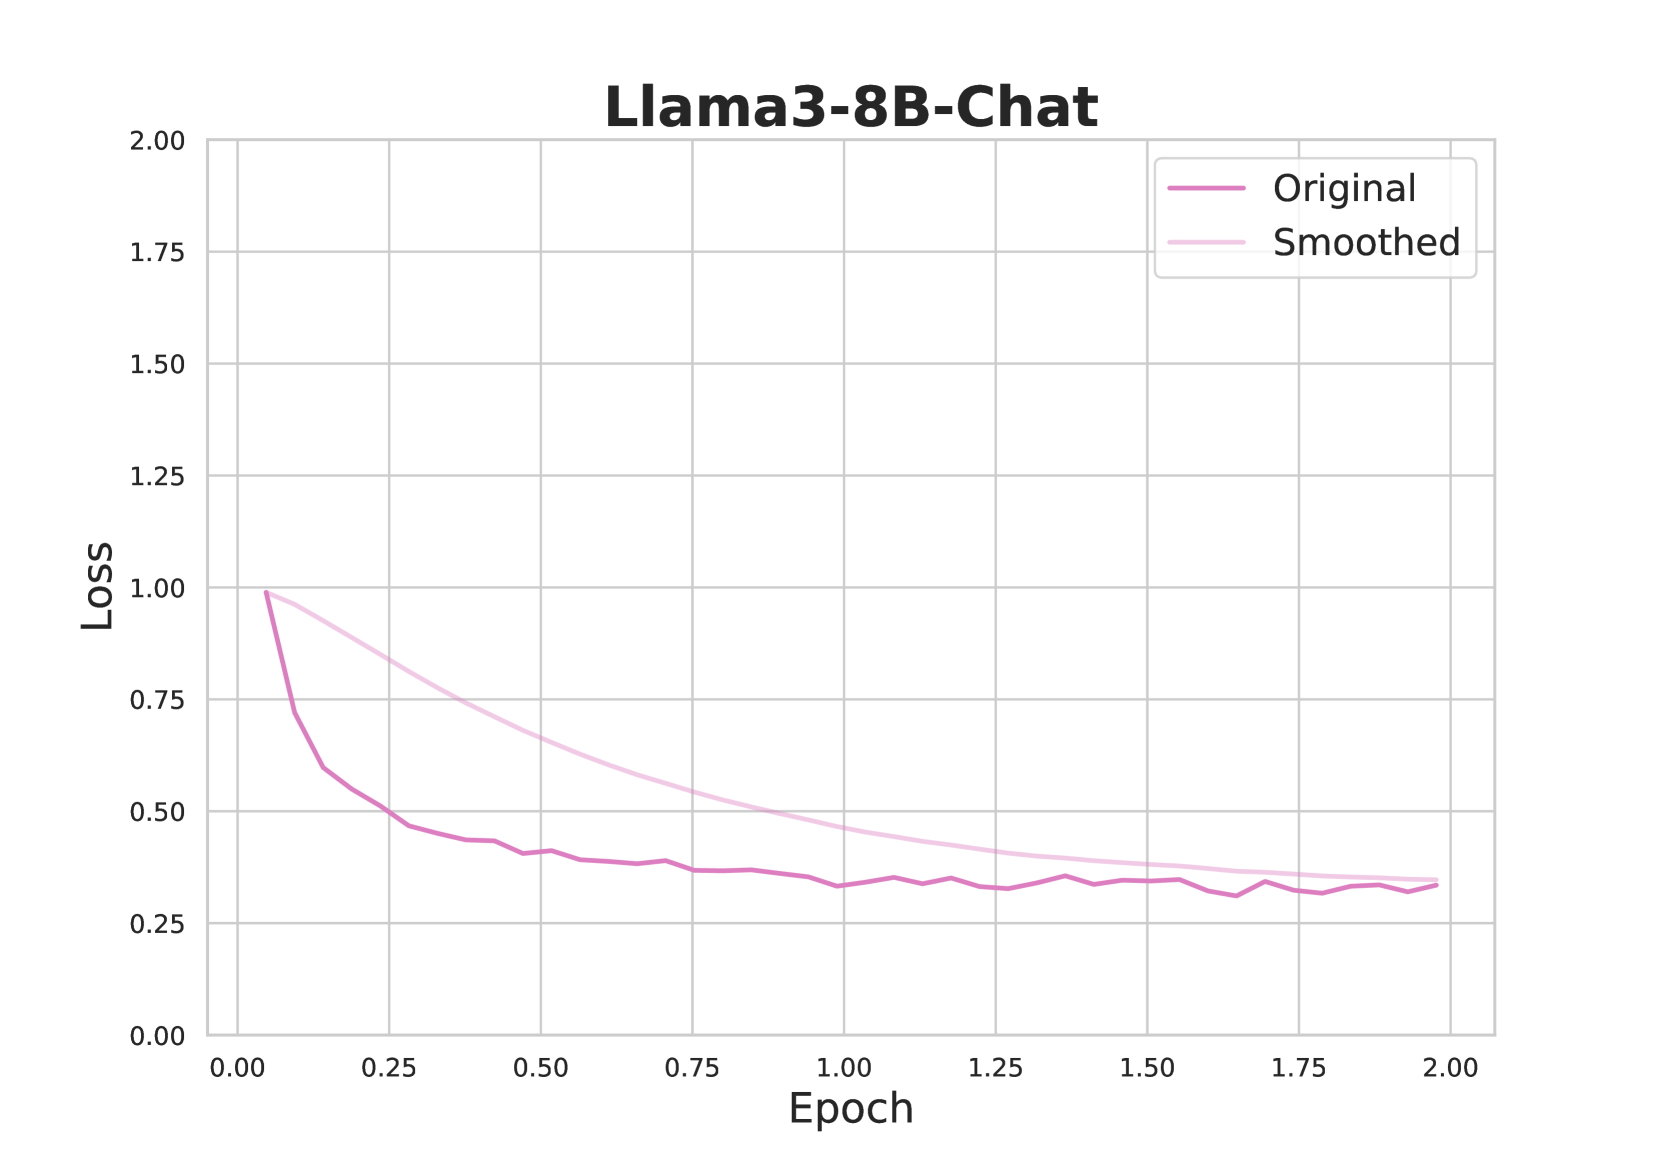
## Line Chart: Llama3-8B-Chat Training Loss
### Overview
This image is a line chart displaying the training loss over epochs for a machine learning model identified as "Llama3-8B-Chat". It plots two versions of the loss metric: the raw, noisy "Original" data and a "Smoothed" version of the same data. The chart demonstrates the model's learning progress, showing a characteristic rapid initial decrease in loss followed by a plateau.
### Components/Axes
* **Title:** "Llama3-8B-Chat" (centered at the top).
* **Y-Axis:** Labeled "Loss". The scale runs from 0.00 to 2.00, with major gridlines and numerical markers at intervals of 0.25 (0.00, 0.25, 0.50, 0.75, 1.00, 1.25, 1.50, 1.75, 2.00).
* **X-Axis:** Labeled "Epoch". The scale runs from 0.00 to 2.00, with major gridlines and numerical markers at intervals of 0.25 (0.00, 0.25, 0.50, 0.75, 1.00, 1.25, 1.50, 1.75, 2.00).
* **Legend:** Located in the top-right corner of the plot area. It contains two entries:
* "Original" - represented by a solid magenta/dark pink line.
* "Smoothed" - represented by a solid light pink line.
* **Plot Area:** Contains a light gray grid for reference.
### Detailed Analysis
**Data Series Trends:**
1. **Original (Magenta Line):**
* **Trend:** Shows a steep, exponential-like decay initially, which then flattens into a noisy plateau.
* **Key Points (Approximate):**
* Starts at a loss of ~1.00 at Epoch 0.00.
* Drops sharply to ~0.60 by Epoch 0.10.
* Continues a slower decline, reaching ~0.45 by Epoch 0.50.
* From Epoch 1.00 to 2.00, the loss fluctuates noisily between approximately 0.30 and 0.40, showing no clear downward trend in this later phase. The final value at Epoch 2.00 is approximately 0.35.
2. **Smoothed (Light Pink Line):**
* **Trend:** Shows a smooth, monotonic decrease that approximates the central tendency of the "Original" line, filtering out high-frequency noise.
* **Key Points (Approximate):**
* Starts at the same point as the Original line: ~1.00 at Epoch 0.00.
* Declines smoothly, passing through ~0.70 at Epoch 0.25, ~0.55 at Epoch 0.75, and ~0.45 at Epoch 1.25.
* The curve flattens significantly after Epoch 1.50, ending at approximately 0.35 at Epoch 2.00, converging with the general level of the noisy Original line.
### Key Observations
1. **Rapid Initial Learning:** The most significant reduction in loss occurs within the first 0.25 epochs, where the loss drops by nearly half (from ~1.00 to ~0.55).
2. **Convergence and Plateau:** After approximately 1.0 epoch, the rate of loss reduction slows dramatically. Both lines indicate the model's training has largely stabilized, with the loss value oscillating around a mean of ~0.35 for the final epoch.
3. **Noise in Raw Data:** The "Original" line exhibits significant step-like fluctuations, especially visible after Epoch 0.5. This is typical of stochastic gradient descent-based training, where loss is calculated on mini-batches.
4. **Effect of Smoothing:** The "Smoothed" line provides a clearer view of the underlying learning curve, removing the batch-to-batch variance to show the overall trajectory of model improvement.
### Interpretation
This chart is a standard diagnostic tool for monitoring the training of a large language model (LLM). The "Loss" metric quantifies the model's prediction error on its training data; a decreasing trend indicates the model is learning.
* **What the data suggests:** The Llama3-8B-Chat model successfully learned from its training data over the course of 2 epochs. The steep initial drop shows it quickly grasped the most obvious patterns. The subsequent plateau suggests it reached a point of diminishing returns, where additional training epochs yield only minor improvements in fitting the training data.
* **Relationship between elements:** The "Smoothed" line is derived from the "Original" line, likely using a moving average or exponential smoothing. Its purpose is to aid human interpretation by highlighting the trend amidst the inherent noise of the training process.
* **Notable patterns/anomalies:** There are no apparent anomalies. The curve shape is textbook for a well-behaved training run. The final loss value (~0.35) is a relative measure; its absolute significance depends on the specific loss function and task, but the clear convergence is the key positive indicator. The fact that the smoothed and original lines converge at the end confirms the smoothing window is appropriate and the model has stabilized.