## Diagram: Multimodal Data Sources to Tasks & Goals via Foundation Model
### Overview
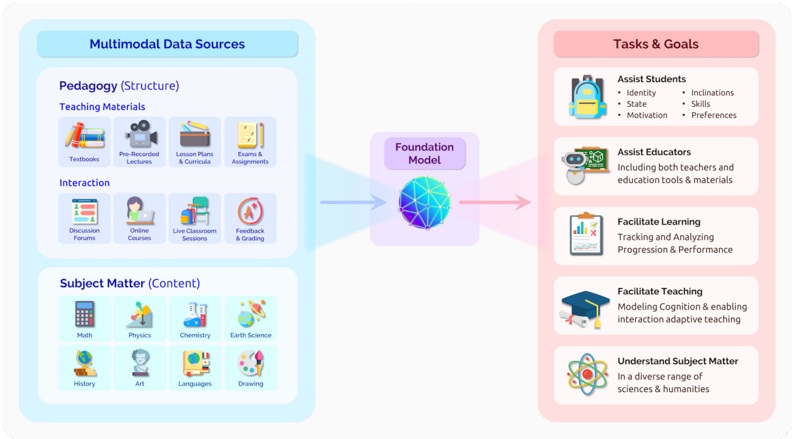
The image is a diagram illustrating how multimodal data sources are processed by a foundation model to achieve various tasks and goals in an educational context. The diagram is divided into three main sections: Multimodal Data Sources (left), Foundation Model (center), and Tasks & Goals (right). Arrows indicate the flow of information from data sources to the foundation model and then to the tasks and goals.
### Components/Axes
**1. Multimodal Data Sources (Left)**
* **Title:** Multimodal Data Sources
* **Pedagogy (Structure):**
* **Title:** Pedagogy (Structure)
* **Teaching Materials:**
* Textbooks
* Pre-Recorded Lectures
* Lesson Plans & Curricula
* Exams & Assignments
* **Interaction:**
* Discussion Forums
* Online Courses
* Live Classroom Sessions
* Feedback & Grading
* **Subject Matter (Content):**
* **Title:** Subject Matter (Content)
* Math
* Physics
* Chemistry
* Earth Science
* History
* Art
* Languages
* Drawing
**2. Foundation Model (Center)**
* **Title:** Foundation Model
* A multicolored, spherical, geometric representation of a model.
**3. Tasks & Goals (Right)**
* **Title:** Tasks & Goals
* **Assist Students:**
* Identity
* State
* Motivation
* Inclinations
* Skills
* Preferences
* **Assist Educators:**
* Including both teachers and education tools & materials
* **Facilitate Learning:**
* Tracking and Analyzing Progression & Performance
* **Facilitate Teaching:**
* Modeling Cognition & enabling interaction adaptive teaching
* **Understand Subject Matter:**
* In a diverse range of sciences & humanities
### Detailed Analysis
* **Multimodal Data Sources:** This section is further divided into "Pedagogy (Structure)" and "Subject Matter (Content)". Pedagogy includes teaching materials like textbooks, lectures, lesson plans, and exams, as well as interaction methods like forums, online courses, live sessions, and feedback. Subject matter covers core subjects like math, physics, chemistry, earth science, history, art, languages, and drawing.
* **Foundation Model:** This is the central processing unit, receiving input from the data sources. It is represented as a complex, multicolored geometric shape, suggesting a sophisticated and multifaceted model.
* **Tasks & Goals:** This section outlines the objectives achieved by processing the data through the foundation model. These include assisting students (identity, state, motivation, inclinations, skills, preferences), assisting educators (with tools and materials), facilitating learning (tracking and analyzing performance), facilitating teaching (modeling cognition and enabling adaptive teaching), and understanding subject matter (across sciences and humanities).
* **Flow:** A blue arrow indicates the flow of data from the "Multimodal Data Sources" to the "Foundation Model". A pink arrow indicates the flow from the "Foundation Model" to the "Tasks & Goals".
### Key Observations
* The diagram emphasizes the importance of diverse data sources in achieving educational goals.
* The "Foundation Model" acts as a central hub, processing data from various sources to support different tasks.
* The tasks and goals are student-centric (assisting students, facilitating learning) and educator-centric (assisting educators, facilitating teaching).
### Interpretation
The diagram illustrates a comprehensive approach to education that leverages a foundation model to process multimodal data sources and achieve specific tasks and goals. It suggests that by integrating various types of data (pedagogical structure and subject matter content) and using a sophisticated processing model, it is possible to enhance both student learning and educator effectiveness. The diagram highlights the interconnectedness of data, processing, and outcomes in a modern educational framework. The use of a "Foundation Model" implies a system capable of generalization and adaptation across different subjects and learning contexts.