## Scatter Plot: Confidence vs. Target Length in High School World History
### Overview
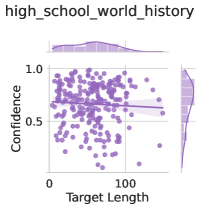
The image is a scatter plot titled "high_school_world_history" depicting the relationship between "Target Length" (x-axis) and "Confidence" (y-axis). A line of best fit is overlaid on the data points, and histograms are displayed on the top and right axes to show distributions. The plot uses purple data points and a dashed line for the regression.
### Components/Axes
- **X-axis (Target Length)**: Labeled "Target Length" with values ranging from 0 to 100. The axis is linear, with ticks at 0, 25, 50, 75, and 100.
- **Y-axis (Confidence)**: Labeled "Confidence" with values ranging from 0.0 to 1.0. The axis is linear, with ticks at 0.0, 0.2, 0.4, 0.6, 0.8, and 1.0.
- **Line of Best Fit**: A dashed line with a slight downward slope, indicating a negative correlation between Target Length and Confidence.
- **Histograms**:
- **Top Histogram**: Shows the distribution of Target Length values, with a peak around 50 and a gradual decline toward 0 and 100.
- **Right Histogram**: Shows the distribution of Confidence values, with a peak near 0.5 and a symmetric spread around this value.
### Detailed Analysis
- **Data Points**: Approximately 100 purple dots are scattered across the plot. Most points cluster between Target Length 20–80 and Confidence 0.3–0.7.
- **Line of Best Fit**: The dashed line slopes downward from left to right, suggesting that as Target Length increases, Confidence decreases. The slope appears to be approximately -0.01 (estimated from the visual trend).
- **Histograms**:
- **Target Length Distribution**: The top histogram indicates a bimodal distribution, with higher frequencies around 50 and 75, and lower frequencies at the extremes (0–20 and 80–100).
- **Confidence Distribution**: The right histogram shows a roughly normal distribution centered at 0.5, with a standard deviation of ~0.15.
### Key Observations
1. **Negative Correlation**: The line of best fit confirms a weak negative relationship between Target Length and Confidence. For example, at Target Length = 50, Confidence ≈ 0.5; at Target Length = 100, Confidence ≈ 0.4.
2. **Distribution Patterns**:
- Target Length values are more concentrated in the mid-range (20–80), with fewer extreme values.
- Confidence values are tightly clustered around 0.5, indicating relatively consistent confidence levels despite varying task lengths.
3. **No Outliers**: No data points deviate significantly from the general trend or distributions.
### Interpretation
The data suggests that in high school world history, students may experience lower confidence when dealing with longer target lengths (e.g., extended essays, complex projects). However, the weak slope of the line of best fit (-0.01) implies this relationship is not strongly deterministic. The histograms reveal that while Target Length varies widely, Confidence remains relatively stable, possibly due to standardized assessment criteria or student adaptability. The absence of outliers suggests no extreme cases of high confidence with very short tasks or low confidence with very long tasks. This could indicate that the dataset reflects typical student performance rather than exceptional cases.