## Scatter Plot: high_school_world_history
### Overview
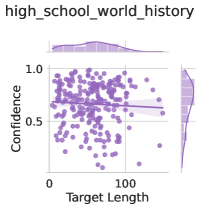
The image is a scatter plot titled "high_school_world_history". It displays the relationship between "Target Length" on the x-axis and "Confidence" on the y-axis. The plot includes a regression line with a confidence interval. Histograms are displayed along the top and right edges, showing the distributions of Target Length and Confidence, respectively.
### Components/Axes
* **Title:** high_school_world_history
* **X-axis:** Target Length
* Scale ranges from 0 to 100.
* **Y-axis:** Confidence
* Scale ranges from 0 to 1.0.
* **Data Points:** Each point represents a data entry, colored in a shade of purple.
* **Regression Line:** A line of best fit is plotted through the data points, with a shaded region indicating the confidence interval.
* **Histograms:**
* Top: Distribution of Target Length.
* Right: Distribution of Confidence.
### Detailed Analysis
* **Target Length Distribution:** The histogram along the top shows a distribution skewed towards lower values, with a peak around 0-20.
* **Confidence Distribution:** The histogram on the right shows a distribution with a peak around 0.6-0.8.
* **Scatter Plot:** The scatter plot shows a cluster of points concentrated between Target Length 0-50 and Confidence 0.5-1.0.
* **Regression Line:** The regression line has a slight negative slope, suggesting a weak negative correlation between Target Length and Confidence.
### Key Observations
* Most data points are clustered at lower Target Length values.
* Confidence values are generally high, with most points above 0.5.
* There is a slight negative trend between Target Length and Confidence.
### Interpretation
The scatter plot suggests that, for the "high_school_world_history" dataset, there is a weak negative correlation between the length of the target text and the confidence score. This could indicate that the model is slightly less confident when dealing with longer target texts. However, the majority of the data points are clustered at lower target lengths and higher confidence values, suggesting that the model generally performs well. The distributions of Target Length and Confidence provide additional context, showing that most target texts are relatively short and that the model is generally confident in its predictions.