## Scatter Plot with Trend Line: High School World History Confidence vs. Target Length
### Overview
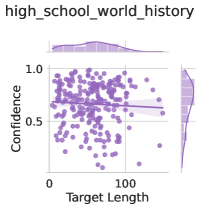
The image is a scatter plot chart titled "high_school_world_history". It visualizes the relationship between "Target Length" (x-axis) and "Confidence" (y-axis) for two data series: "Train" and "Test". A trend line with a shaded confidence interval is overlaid on the data points.
### Components/Axes
* **Title:** `high_school_world_history` (positioned at the top center).
* **Y-Axis:**
* Label: `Confidence`
* Scale: Linear, ranging from 0 to 1.0.
* Major Tick Marks: 0, 0.5, 1.0.
* **X-Axis:**
* Label: `Target Length`
* Scale: Linear, ranging from 0 to approximately 150.
* Major Tick Marks: 0, 100.
* **Legend:** Positioned in the top-right corner of the plot area.
* `Train`: Represented by purple circles (●).
* `Test`: Represented by light purple squares (■).
* **Data Series:**
* **Train (Purple Circles):** A dense cloud of points scattered across the plot.
* **Test (Light Purple Squares):** A smaller set of points, primarily clustered in the central region of the plot.
* **Trend Line:** A solid, dark purple line running through the data, showing a slight downward slope from left to right.
* **Confidence Interval:** A semi-transparent, light purple shaded area surrounding the trend line, indicating the uncertainty or variance of the trend.
### Detailed Analysis
* **Data Distribution:**
* The **Train** data points (purple circles) are widely dispersed. They span nearly the full range of Confidence (from near 0 to 1.0) and a broad range of Target Length (from near 0 to ~150). The density appears highest in the central region (Target Length ~20-80, Confidence ~0.3-0.8).
* The **Test** data points (light purple squares) are fewer in number and more concentrated. They are primarily located within a Target Length range of approximately 40 to 120 and a Confidence range of approximately 0.4 to 0.8.
* **Trend Line Analysis:**
* The trend line exhibits a **gentle negative slope**. It starts at a Confidence value of approximately 0.65 when Target Length is 0 and decreases to approximately 0.55 when Target Length is 150.
* The shaded confidence interval is relatively narrow, suggesting the modeled trend has moderate certainty, though the underlying data points show high variance.
### Key Observations
1. **High Variance in Training Data:** The Train series shows extremely high variance in Confidence scores for any given Target Length, indicating a weak direct correlation between these two variables in the training set.
2. **Test Data Clustering:** The Test data is not uniformly distributed but forms a loose cluster in the middle of the plot, suggesting the test examples may have been selected from a specific subset of the problem space (e.g., medium-length answers).
3. **Weak Negative Trend:** Despite the high scatter, the overall modeled trend suggests a slight decrease in Confidence as Target Length increases.
4. **Overlap Region:** The majority of the Test data points fall within the dense central region of the Train data distribution, indicating the test set is representative of the core training data.
### Interpretation
This chart likely evaluates the performance of a model (e.g., a question-answering or grading model) on a "high school world history" task. "Target Length" probably refers to the length of a student's answer or a reference answer, while "Confidence" is the model's confidence score in its prediction or assessment.
The data suggests that the model's confidence is not strongly determined by answer length alone, given the massive scatter. The slight negative trend could imply the model becomes marginally less confident when evaluating very long answers, possibly due to increased complexity or noise. The clustering of test data highlights a potential limitation: the model's performance is primarily validated on medium-length answers, and its behavior on very short or very long answers (where training data is also sparse) is less certain. The high variance in the training data underscores that other factors beyond length—such as answer content, specificity, or quality—are likely the primary drivers of the model's confidence score.