# Technical Document Extraction: Attention Key Query Problem
## Chart Title
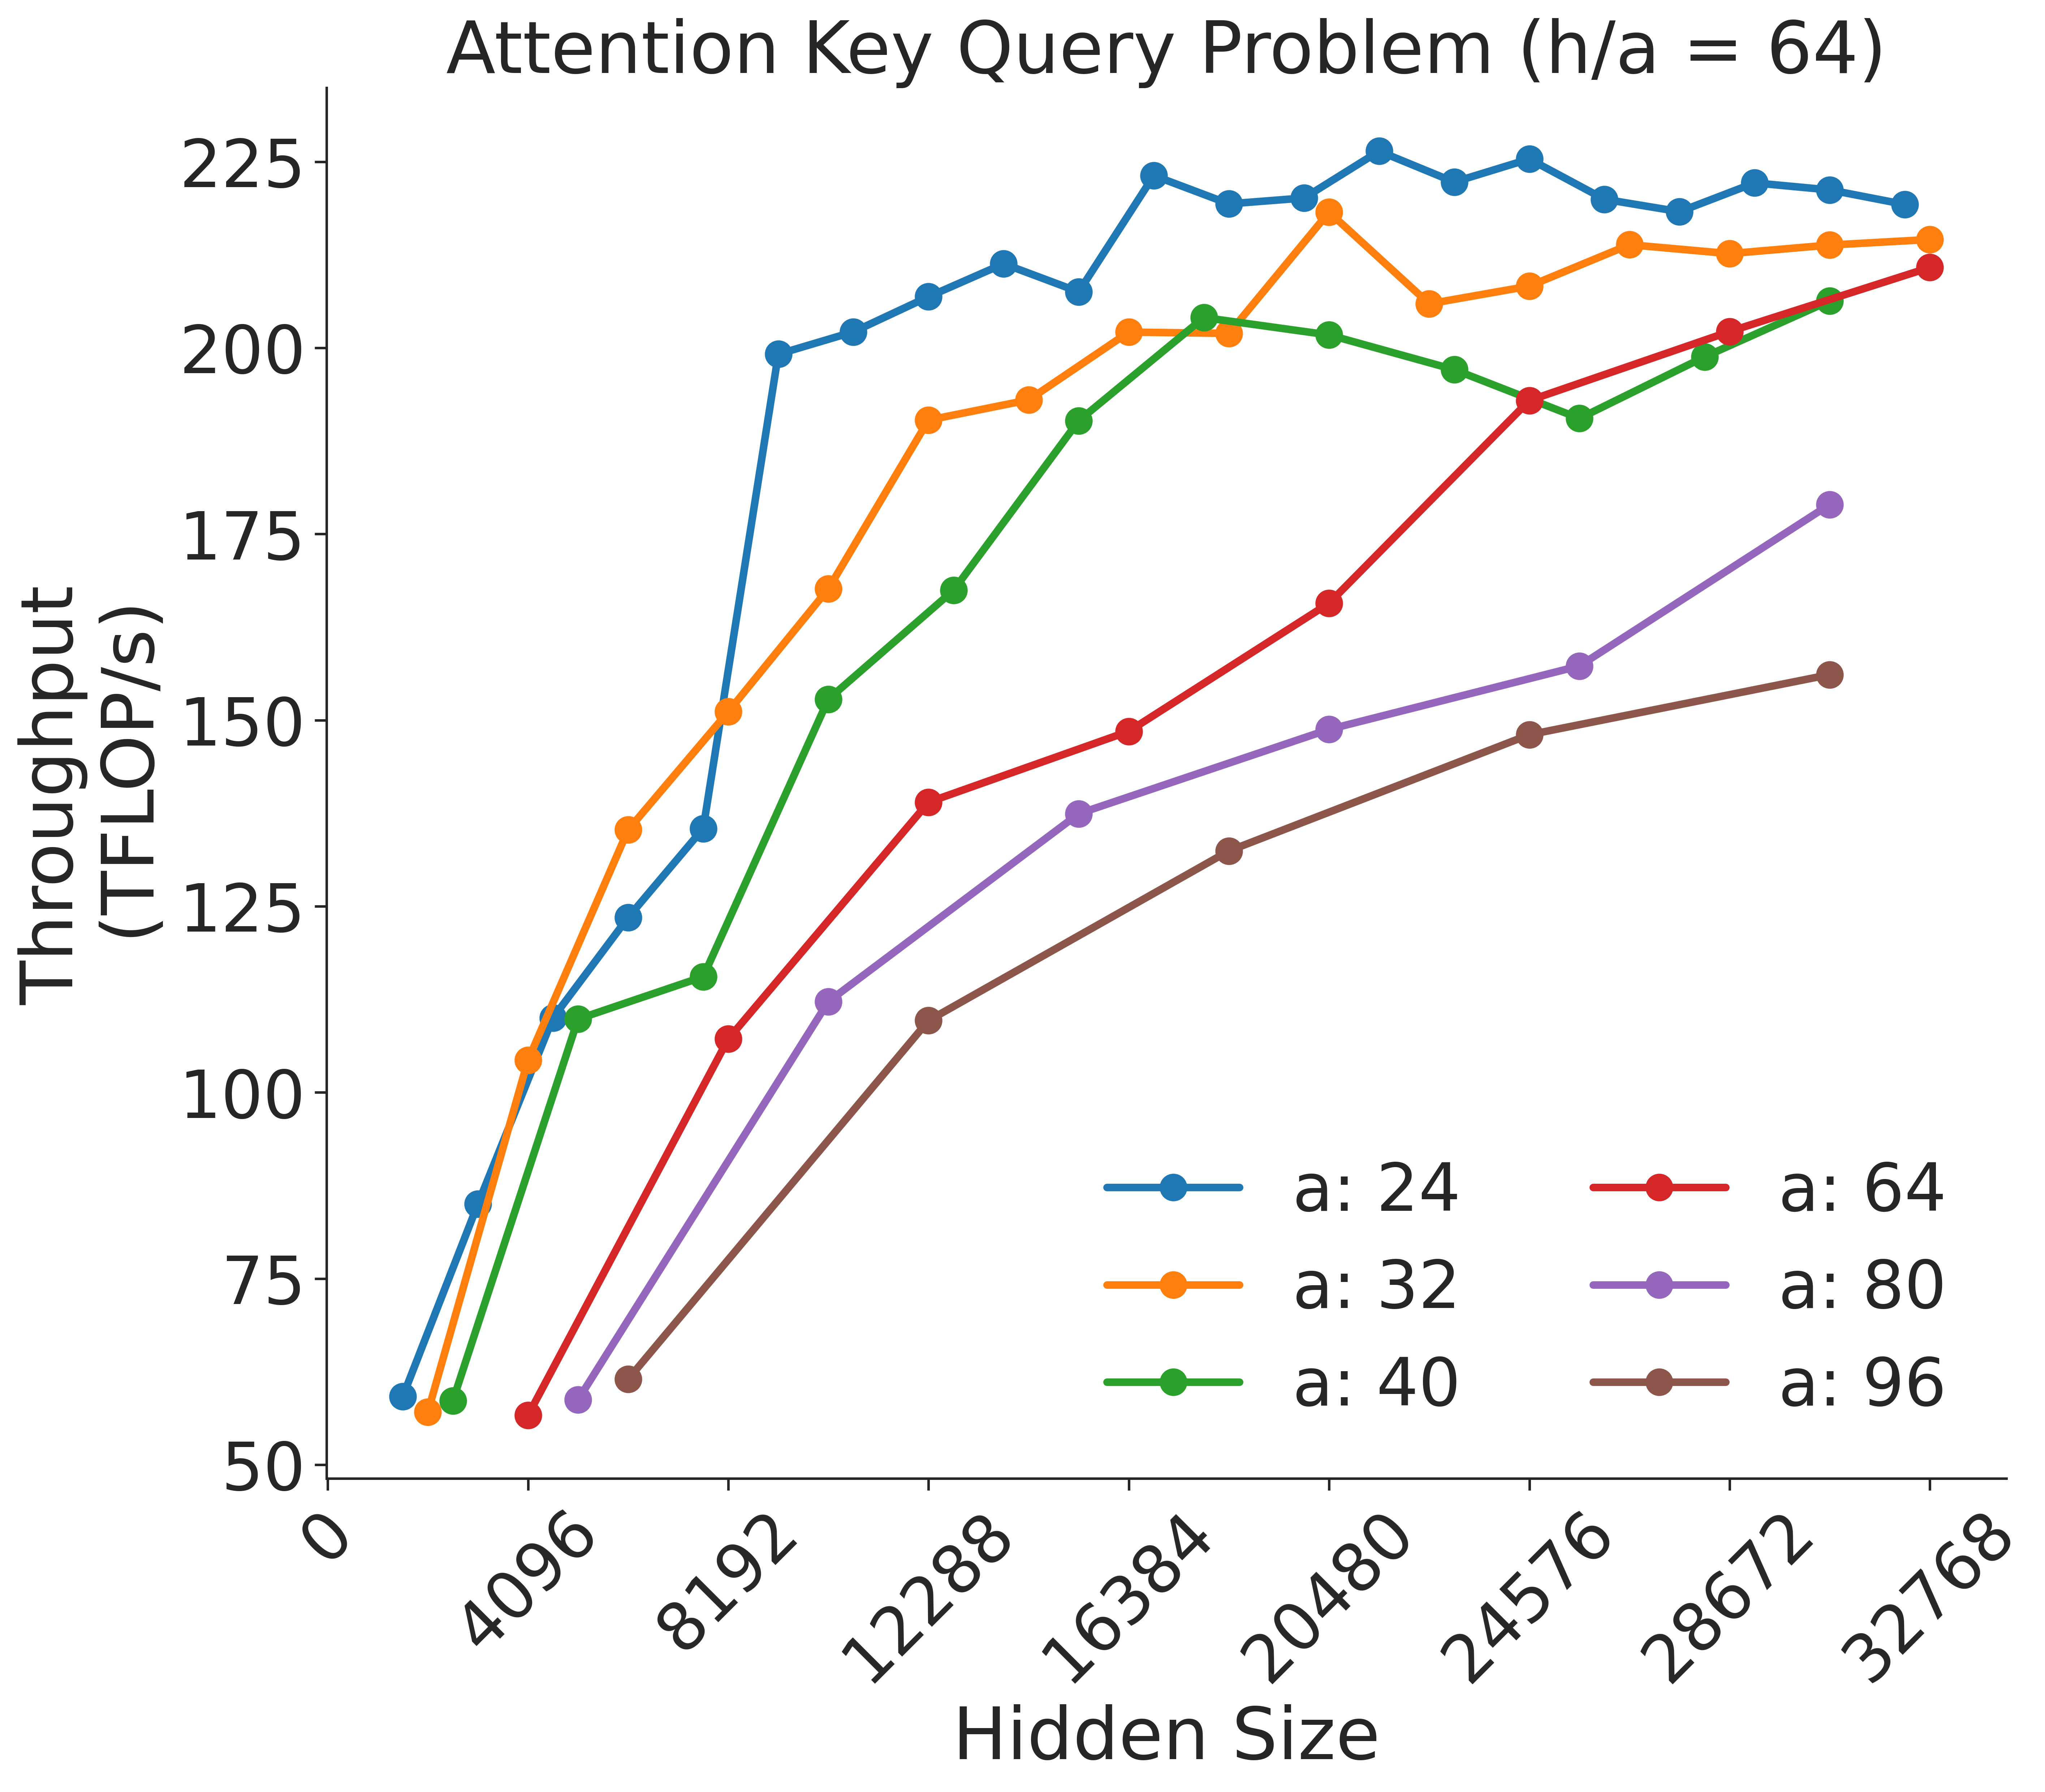
**Attention Key Query Problem (h/a = 64)**
## Axes
- **X-axis**: Hidden Size (values: 0, 4096, 8192, 12288, 16384, 20480, 24576, 28672, 32768)
- **Y-axis**: Throughput (TFLOP/s) (values: 50, 75, 100, 125, 150, 175, 200, 225)
## Legend
- **Location**: Bottom-right corner
- **Color-Coded Labels**:
- Blue: `a:24`
- Red: `a:64`
- Orange: `a:32`
- Purple: `a:80`
- Green: `a:40`
- Brown: `a:96`
## Data Series Analysis
### 1. Blue Line (`a:24`)
- **Trend**: Steep initial increase, then plateaus near 225 TFLOP/s
- **Key Points**:
- [0, 50] → [4096, 100] → [8192, 130] → [12288, 200] → [16384, 225] → [20480, 225] → [24576, 220] → [28672, 220] → [32768, 220]
### 2. Red Line (`a:64`)
- **Trend**: Gradual upward slope, ending near 210 TFLOP/s
- **Key Points**:
- [0, 50] → [4096, 55] → [8192, 105] → [12288, 135] → [16384, 150] → [20480, 170] → [24576, 190] → [28672, 200] → [32768, 210]
### 3. Orange Line (`a:32`)
- **Trend**: Steep rise, plateauing near 215 TFLOP/s
- **Key Points**:
- [0, 50] → [4096, 100] → [8192, 150] → [12288, 190] → [16384, 205] → [20480, 215] → [24576, 210] → [28672, 215] → [32768, 215]
### 4. Purple Line (`a:80`)
- **Trend**: Moderate upward slope, ending near 180 TFLOP/s
- **Key Points**:
- [0, 50] → [4096, 55] → [8192, 110] → [12288, 130] → [16384, 140] → [20480, 150] → [24576, 160] → [28672, 175] → [32768, 180]
### 5. Green Line (`a:40`)
- **Trend**: Steady increase, plateauing near 205 TFLOP/s
- **Key Points**:
- [0, 50] → [4096, 100] → [8192, 120] → [12288, 170] → [16384, 200] → [20480, 205] → [24576, 195] → [28672, 205] → [32768, 205]
### 6. Brown Line (`a:96`)
- **Trend**: Gradual rise, ending near 160 TFLOP/s
- **Key Points**:
- [0, 50] → [4096, 55] → [8192, 65] → [12288, 110] → [16384, 130] → [20480, 140] → [24576, 150] → [28672, 160] → [32768, 160]
## Spatial Grounding
- **Legend Position**: Bottom-right corner (confirmed via visual alignment with data series)
- **Color Consistency**: All legend colors match corresponding data series (e.g., blue = `a:24`, red = `a:64`).
## Critical Observations
1. **Performance Scaling**: Higher `a` values (e.g., `a:24`, `a:32`) achieve higher throughput at larger hidden sizes.
2. **Efficiency Tradeoff**: Larger `a` values (e.g., `a:96`) show diminishing returns despite increased computational cost.
3. **Optimal Range**: Hidden sizes between 16384 and 28672 yield peak performance for most `a` configurations.
## Notes
- The chart explicitly ties performance (TFLOP/s) to hidden size and `a` parameter configurations.
- No additional textual data or tables are present in the image.