\n
## Diagram: Neural Network Architecture
### Overview
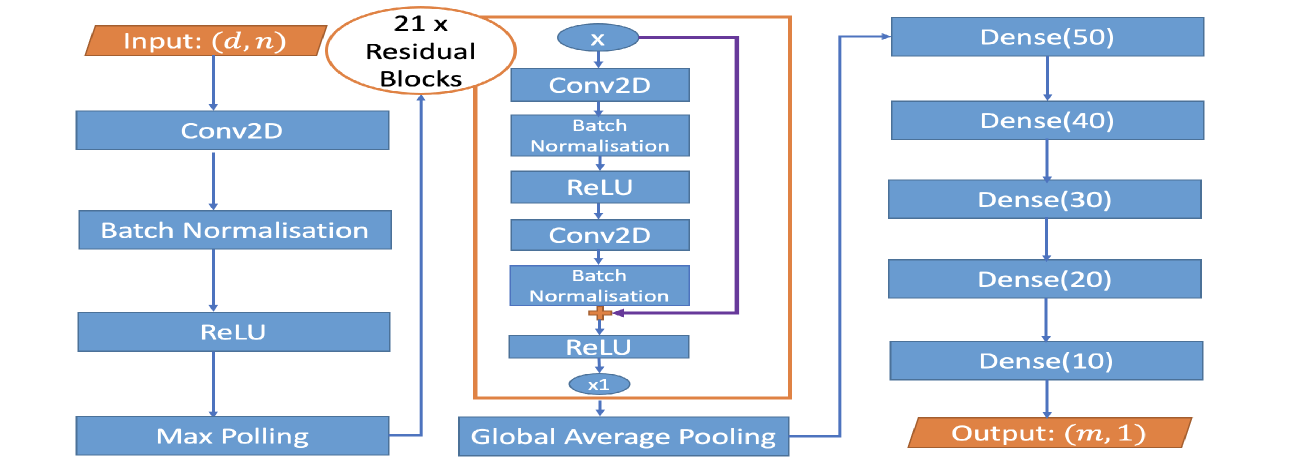
The image depicts the architecture of a neural network, likely for image classification or regression. It shows a sequence of layers, starting with an input layer, followed by convolutional layers, residual blocks, and finally, dense (fully connected) layers leading to an output layer. The diagram illustrates the flow of data through these layers.
### Components/Axes
The diagram consists of the following components:
* **Input:** (d, n) - Represents the input layer with dimensions 'd' and 'n'.
* **Conv2D:** Convolutional 2D layers.
* **Batch Normalisation:** Batch normalization layers.
* **ReLU:** Rectified Linear Unit activation functions.
* **Max Polling:** Max pooling layers.
* **Residual Blocks:** A series of 21 residual blocks.
* **Global Average Pooling:** Global average pooling layer.
* **Dense(50), Dense(40), Dense(30), Dense(20), Dense(10):** Dense (fully connected) layers with 50, 40, 30, 20, and 10 neurons respectively.
* **Output:** (m, 1) - Represents the output layer with dimensions 'm' and 1.
* **Arrows:** Indicate the flow of data between layers.
* **Multiplication Symbols (x):** Indicate repetition of layers (x1 and x21).
### Detailed Analysis or Content Details
The diagram can be broken down into three main sections:
**Left Section (Feature Extraction):**
1. **Input (d, n):** The input layer.
2. **Conv2D:** A convolutional layer.
3. **Batch Normalisation:** Normalizes the output of the Conv2D layer.
4. **ReLU:** Applies the ReLU activation function.
5. **Max Polling:** Reduces the spatial dimensions of the feature maps.
**Center Section (Residual Blocks):**
1. **21 x Residual Blocks:** A series of 21 identical residual blocks. Each block consists of:
* **Conv2D:** A convolutional layer.
* **Batch Normalisation:** Normalizes the output of the Conv2D layer.
* **ReLU:** Applies the ReLU activation function.
* **Conv2D:** Another convolutional layer.
* **Batch Normalisation:** Normalizes the output of the second Conv2D layer.
* **ReLU:** Applies the ReLU activation function.
2. **Global Average Pooling:** Reduces the spatial dimensions to a single value per feature map.
**Right Section (Classification/Regression):**
1. **Dense(50):** A fully connected layer with 50 neurons.
2. **Dense(40):** A fully connected layer with 40 neurons.
3. **Dense(30):** A fully connected layer with 30 neurons.
4. **Dense(20):** A fully connected layer with 20 neurons.
5. **Dense(10):** A fully connected layer with 10 neurons.
6. **Output (m, 1):** The output layer.
The flow of data is as follows: Input -> Conv2D -> Batch Normalisation -> ReLU -> Max Polling -> 21 x Residual Blocks -> Global Average Pooling -> Dense(50) -> Dense(40) -> Dense(30) -> Dense(20) -> Dense(10) -> Output.
### Key Observations
* The architecture utilizes a significant number of residual blocks (21), suggesting a deep network designed to mitigate the vanishing gradient problem.
* The use of Batch Normalisation after each convolutional layer likely improves training stability and speed.
* The Global Average Pooling layer reduces the number of parameters and helps prevent overfitting.
* The decreasing number of neurons in the dense layers (50, 40, 30, 20, 10) suggests a funneling of information towards the output layer.
### Interpretation
This diagram represents a convolutional neural network (CNN) architecture, likely designed for image-related tasks. The initial convolutional layers and residual blocks are responsible for feature extraction from the input image. The residual blocks allow for the training of very deep networks without suffering from the vanishing gradient problem. The Global Average Pooling layer summarizes the extracted features, and the subsequent dense layers perform the classification or regression task. The output layer (m, 1) suggests that the network is designed to predict a single value (regression) or classify the input into 'm' categories. The architecture is a common pattern for image recognition tasks, leveraging the power of deep learning to learn complex patterns from image data. The specific values of 'd', 'n', and 'm' would determine the exact input and output dimensions of the network.