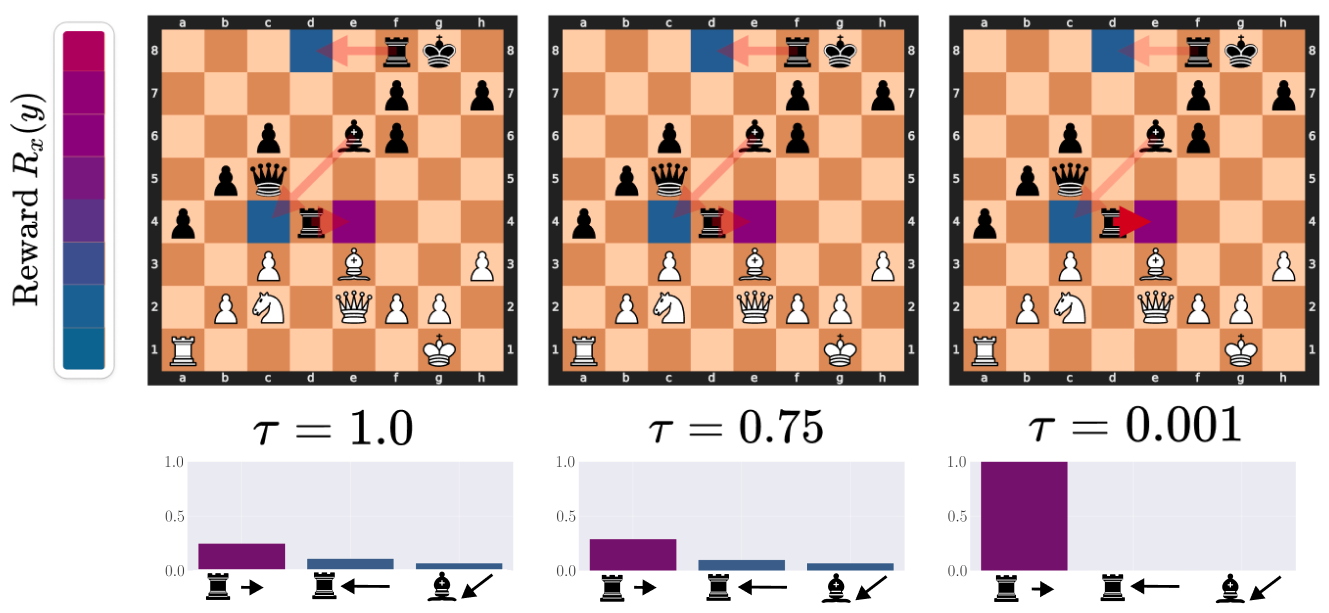
# Technical Document Extraction: Chess Reward Visualization Analysis
This document provides a technical breakdown of an image illustrating the relationship between a temperature parameter ($\tau$), chess move rewards, and probability distributions in a reinforcement learning or AI context.
## 1. Component Overview
The image is organized into three vertical columns, each representing a different value for the parameter $\tau$. Each column consists of:
- **Top:** A chess board heatmap visualization.
- **Middle:** A mathematical label for the $\tau$ value.
- **Bottom:** A bar chart showing the probability distribution of specific moves.
- **Left Margin:** A vertical color scale legend.
---
## 2. Legend and Scale (Left Margin)
**Spatial Placement:** [x: 0, y: 0-500] (Leftmost vertical element).
- **Label:** $Reward \ R_x(y)$
- **Type:** Discrete color gradient scale.
- **Color Mapping:**
- **Dark Blue (Bottom):** Represents lower reward values.
- **Purple/Magenta (Top):** Represents higher reward values.
- **Function:** This scale is used to color-code the squares on the chessboards and the bars in the charts below.
---
## 3. Comparative Analysis by Temperature ($\tau$)
The image compares three states of a Softmax-like distribution where $\tau$ controls the "sharpness" of the selection.
### Region A: $\tau = 1.0$ (High Temperature/Stochastic)
- **Chess Board Visualization:**
- **Highlighted Squares:** Square **d8** is colored Blue (Low reward). Square **e4** is colored Magenta (High reward). Square **c4** is colored Blue (Low reward).
- **Visual Indicators:** Three semi-transparent red arrows originate from pieces:
1. Black Rook on f8 pointing to d8.
2. Black Bishop on e6 pointing to c4.
3. Black Rook on d4 pointing to e4.
- **Bar Chart Data:**
- **Trend:** The distribution is relatively flat (high entropy).
- **Move 1 (Rook right $\rightarrow$):** Magenta bar, value $\approx 0.25$.
- **Move 2 (Rook left $\leftarrow$):** Blue bar, value $\approx 0.10$.
- **Move 3 (Bishop diagonal $\swarrow$):** Dark Blue bar, value $\approx 0.05$.
### Region B: $\tau = 0.75$ (Moderate Temperature)
- **Chess Board Visualization:** The board state and highlighted squares remain identical to the $\tau = 1.0$ board.
- **Bar Chart Data:**
- **Trend:** The gap between the highest reward move and others begins to widen.
- **Move 1 (Rook right $\rightarrow$):** Magenta bar, value $\approx 0.30$ (Slightly higher than $\tau=1.0$).
- **Move 2 (Rook left $\leftarrow$):** Blue bar, value $\approx 0.10$.
- **Move 3 (Bishop diagonal $\swarrow$):** Dark Blue bar, value $\approx 0.05$.
### Region C: $\tau = 0.001$ (Low Temperature/Deterministic)
- **Chess Board Visualization:** The board state remains identical. However, the arrow for the move to **e4** (Rook right) is more opaque/saturated, indicating it is the chosen path.
- **Bar Chart Data:**
- **Trend:** "Winner-take-all" distribution. The highest reward move captures nearly all probability mass.
- **Move 1 (Rook right $\rightarrow$):** Magenta bar, value $= 1.0$.
- **Move 2 (Rook left $\leftarrow$):** Blue bar, value $\approx 0.0$.
- **Move 3 (Bishop diagonal $\swarrow$):** Dark Blue bar, value $\approx 0.0$.
---
## 4. Chess Board Technical Details
All three boards display the same position:
- **Dimensions:** 8x8 grid, labeled **a-h** (horizontal) and **1-8** (vertical).
- **Key Piece Positions:**
- **White:** King (g1), Rook (a1), Knight (c2), Queen (e2), Pawns (b2, d3, f2, g2, h3).
- **Black:** King (g8), Rook (f8), Rook (d4), Queen (c5), Bishop (e6), Pawns (a4, b5, c6, f6, f7, h7).
- **Active Move Analysis (Black to move):**
- **Move 1:** Rook at d4 to e4 (Target square is Magenta/High Reward).
- **Move 2:** Rook at f8 to d8 (Target square is Blue/Low Reward).
- **Move 3:** Bishop at e6 to c4 (Target square is Blue/Low Reward).
---
## 5. Summary of Findings
The document illustrates that as the temperature parameter $\tau$ decreases from $1.0$ to $0.001$:
1. The probability distribution shifts from being spread across multiple moves to being concentrated entirely on the move with the highest reward ($R_x(y)$).
2. At $\tau = 0.001$, the system acts deterministically, selecting the Magenta-coded move (Rook to e4) with 100% probability.
3. The visual encoding (Magenta = High, Blue = Low) is consistent across the heatmap squares and the corresponding bar chart columns.