## Scatter Plot: Harmlessness vs. Helpfulness
### Overview
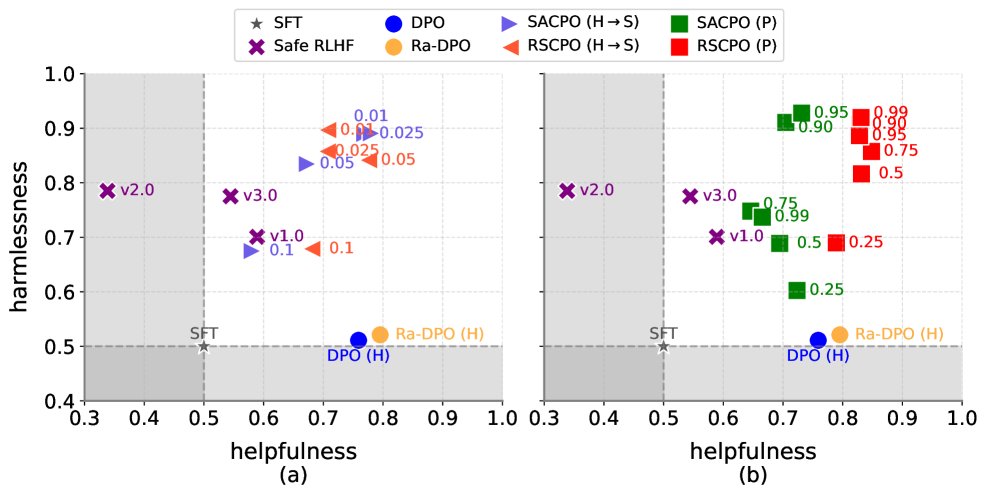
The image presents two scatter plots, (a) and (b), comparing the harmlessness and helpfulness of different models. The plots show the performance of various algorithms, including SFT, Safe RLHF, DPO, Ra-DPO, SACPO (H->S), SACPO (P), RSCPO (H->S), and RSCPO (P). The x-axis represents helpfulness, and the y-axis represents harmlessness. A gray shaded region indicates an area of lower performance.
### Components/Axes
* **Title:** Harmlessness vs. Helpfulness
* **X-axis (Helpfulness):** Ranges from 0.3 to 1.0 in both plots.
* **Y-axis (Harmlessness):** Ranges from 0.4 to 1.0 in both plots.
* **Legend (Top):**
* `★ SFT` (Gray Star)
* `X Safe RLHF` (Purple X)
* `DPO` (Blue Circle)
* `Ra-DPO` (Orange Circle)
* `SACPO (H->S)` (Blue Triangle pointing right)
* `SACPO (P)` (Green Square)
* `RSCPO (H->S)` (Orange Triangle pointing right)
* `RSCPO (P)` (Red Square)
* **Plot (a):** Labeled as "(a)" below the x-axis.
* **Plot (b):** Labeled as "(b)" below the x-axis.
* **Gray Shaded Region:** Located in the bottom-left corner of each plot, indicating a region of lower performance. The gray region extends to x=0.5 and y=0.5.
* **Axis Markers:** Both axes have grid lines at intervals of 0.1.
### Detailed Analysis or Content Details
#### Plot (a)
* **SFT (Gray Star):** Located at approximately (0.5, 0.5).
* **Safe RLHF (Purple X):**
* v2.0: Located at approximately (0.35, 0.8).
* v3.0: Located at approximately (0.55, 0.8).
* v1.0: Located at approximately (0.6, 0.7).
* **DPO (Blue Circle):** Located at approximately (0.7, 0.52). Labeled as DPO (H).
* **Ra-DPO (Orange Circle):** Located at approximately (0.8, 0.52). Labeled as Ra-DPO (H).
* **SACPO (H->S) (Blue Triangle):** Data points are clustered around (0.7, 0.7) and (0.7, 0.9). Specific values are approximately 0.01, 0.025, and 0.05 for Harmlessness.
* **RSCPO (H->S) (Orange Triangle):** Data points are clustered around (0.75, 0.7) and (0.75, 0.9). Specific values are approximately 0.025, 0.05, and 0.1 for Harmlessness.
#### Plot (b)
* **SFT (Gray Star):** Located at approximately (0.5, 0.5).
* **Safe RLHF (Purple X):**
* v2.0: Located at approximately (0.35, 0.8).
* v3.0: Located at approximately (0.55, 0.8).
* v1.0: Located at approximately (0.6, 0.7).
* **DPO (Blue Circle):** Located at approximately (0.75, 0.52). Labeled as DPO (H).
* **Ra-DPO (Orange Circle):** Located at approximately (0.8, 0.52). Labeled as Ra-DPO (H).
* **SACPO (P) (Green Square):** Data points are clustered in the top-right quadrant. Specific values for Harmlessness are approximately 0.25, 0.5, 0.75, 0.90, 0.95, and 0.99. Helpfulness values are approximately 0.7.
* **RSCPO (P) (Red Square):** Data points are clustered in the top-right quadrant. Specific values for Harmlessness are approximately 0.25, 0.5, 0.75, 0.90, 0.95, and 0.99. Helpfulness values are approximately 0.8.
### Key Observations
* **SFT:** Serves as a baseline, consistently positioned at (0.5, 0.5) in both plots.
* **Safe RLHF:** The "Safe RLHF" data points (v1.0, v2.0, v3.0) remain in the same position in both plots.
* **DPO and Ra-DPO:** The DPO (H) and Ra-DPO (H) points are located near each other in both plots, indicating similar performance.
* **SACPO and RSCPO (H->S) in Plot (a):** These algorithms show a cluster of points with varying harmlessness values, but relatively low helpfulness.
* **SACPO and RSCPO (P) in Plot (b):** These algorithms show a cluster of points with high harmlessness and helpfulness values.
### Interpretation
The plots compare the harmlessness and helpfulness of different models. Plot (a) shows the performance of SACPO and RSCPO when trained using a specific method (H->S), while plot (b) shows the performance when trained using a different method (P). The results suggest that the training method significantly impacts the performance of SACPO and RSCPO. Specifically, the (P) method leads to much higher harmlessness and helpfulness compared to the (H->S) method. The Safe RLHF variants remain consistent across both plots, suggesting their performance is independent of the SACPO/RSCPO training variations. The DPO and Ra-DPO models show similar performance in terms of harmlessness and helpfulness. The gray shaded region highlights the area where models perform poorly in both harmlessness and helpfulness.