## Scatter Plot: Helpfulness vs. Harmlessness (Two Subplots)
### Overview
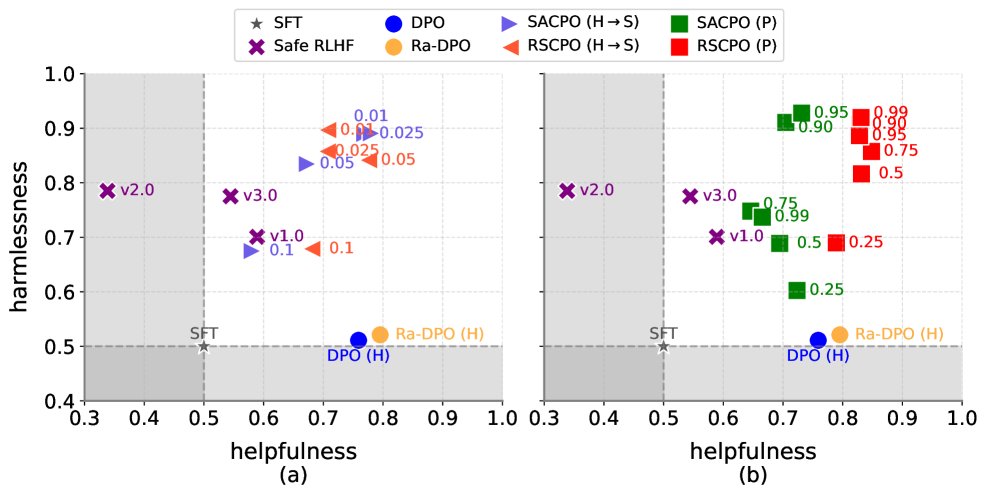
The image contains two scatter plots (subplots a and b) comparing **helpfulness** (x-axis) and **harmlessness** (y-axis) for various model configurations. Each subplot includes data points labeled with model names, versions, and numerical values. The plots use distinct colors and markers to differentiate categories, with shaded regions indicating thresholds or regions of interest.
---
### Components/Axes
- **X-axis (Helpfulness)**: Ranges from 0.3 to 1.0 in both subplots.
- **Y-axis (Harmlessness)**: Ranges from 0.4 to 1.0 in both subplots.
- **Legend**:
- **SFT**: Star symbol (gray).
- **DPO**: Blue circle.
- **SACPO (H→S)**: Blue triangle.
- **SACPO (P)**: Green square.
- **Safe RLHF**: Purple cross (v1.0, v2.0, v3.0).
- **Ra-DPO (H)**: Orange circle.
- **RSCPO (H→S)**: Red triangle.
- **RSCPO (P)**: Red square.
- **Shaded Regions**:
- Subplot (a): Gray area from x=0.3 to 0.5.
- Subplot (b): Gray area from x=0.3 to 0.6.
---
### Detailed Analysis
#### Subplot (a)
- **Safe RLHF (Purple Crosses)**:
- v1.0: (0.6, 0.7)
- v2.0: (0.55, 0.8)
- v3.0: (0.65, 0.75)
- **SACPO (H→S) (Blue Triangles)**:
- 0.05: (0.65, 0.9)
- 0.01: (0.7, 0.85)
- 0.025: (0.75, 0.8)
- **RSCPO (H→S) (Red Triangles)**:
- 0.1: (0.6, 0.7)
- 0.05: (0.65, 0.8)
- 0.025: (0.7, 0.75)
- **DPO (H) (Blue Circle)**: (0.7, 0.5)
- **Ra-DPO (H) (Orange Circle)**: (0.8, 0.5)
- **SFT (Star)**: (0.5, 0.5)
#### Subplot (b)
- **SACPO (P) (Green Squares)**:
- 0.95: (0.65, 0.95)
- 0.99: (0.7, 0.99)
- 0.90: (0.75, 0.90)
- 0.75: (0.6, 0.75)
- 0.5: (0.55, 0.5)
- **RSCPO (P) (Red Squares)**:
- 0.5: (0.65, 0.5)
- 0.75: (0.7, 0.75)
- 0.95: (0.75, 0.95)
- 0.25: (0.6, 0.25)
- **DPO (H) (Blue Circle)**: (0.7, 0.5)
- **Ra-DPO (H) (Orange Circle)**: (0.8, 0.5)
- **SFT (Star)**: (0.5, 0.5)
---
### Key Observations
1. **Safe RLHF Models**:
- Clustered in the lower-left region (helpfulness < 0.7, harmlessness > 0.6).
- v2.0 has the highest harmlessness (0.8) but lower helpfulness (0.55).
2. **SACPO (H→S) and RSCPO (H→S)**:
- SACPO (H→S) (blue triangles) shows higher harmlessness (0.8–0.9) but lower helpfulness (0.65–0.75).
- RSCPO (H→S) (red triangles) has higher helpfulness (0.6–0.7) but lower harmlessness (0.75–0.8).
3. **DPO (H) and Ra-DPO (H)**:
- Both at (0.7, 0.5) and (0.8, 0.5), respectively, indicating moderate helpfulness and low harmlessness.
- Ra-DPO (H) has higher helpfulness but same harmlessness as DPO (H).
4. **SACPO (P) and RSCPO (P)**:
- SACPO (P) (green squares) dominates in harmlessness (0.75–0.99) with high helpfulness (0.6–0.9).
- RSCPO (P) (red squares) shows lower harmlessness (0.25–0.95) despite similar helpfulness.
5. **Shaded Regions**:
- Subplot (a) highlights models with helpfulness < 0.5 (SFT, Safe RLHF).
- Subplot (b) emphasizes models with helpfulness < 0.6 (SFT, SACPO (P), RSCPO (P)).
---
### Interpretation
- **Trade-offs Between Helpfulness and Harmlessness**:
- Safe RLHF models prioritize harmlessness over helpfulness, placing them in the lower-left quadrant.
- SACPO (H→S) and RSCPO (H→S) represent intermediate trade-offs, with SACPO (H→S) favoring harmlessness and RSCPO (H→S) favoring helpfulness.
- SACPO (P) and RSCPO (P) in subplot (b) show that SACPO (P) maintains high harmlessness even at high helpfulness, while RSCPO (P) sacrifices harmlessness for helpfulness.
- **Outliers**:
- Ra-DPO (H) (0.8, 0.5) and DPO (H) (0.7, 0.5) are outliers in subplot (a), showing high helpfulness but low harmlessness.
- SACPO (P) (0.7, 0.99) in subplot (b) is an outlier with near-perfect harmlessness.
- **Implications**:
- Models like SACPO (P) and Safe RLHF v2.0 may be preferable for safety-critical applications.
- RSCPO (P) and Ra-DPO (H) might be better for scenarios requiring higher helpfulness, even at the cost of increased risk.
- The shaded regions suggest thresholds for acceptable performance, with some models (e.g., SACPO (P)) exceeding these limits.