## Line Chart: Accuracy vs. Top-k Predicates
### Overview
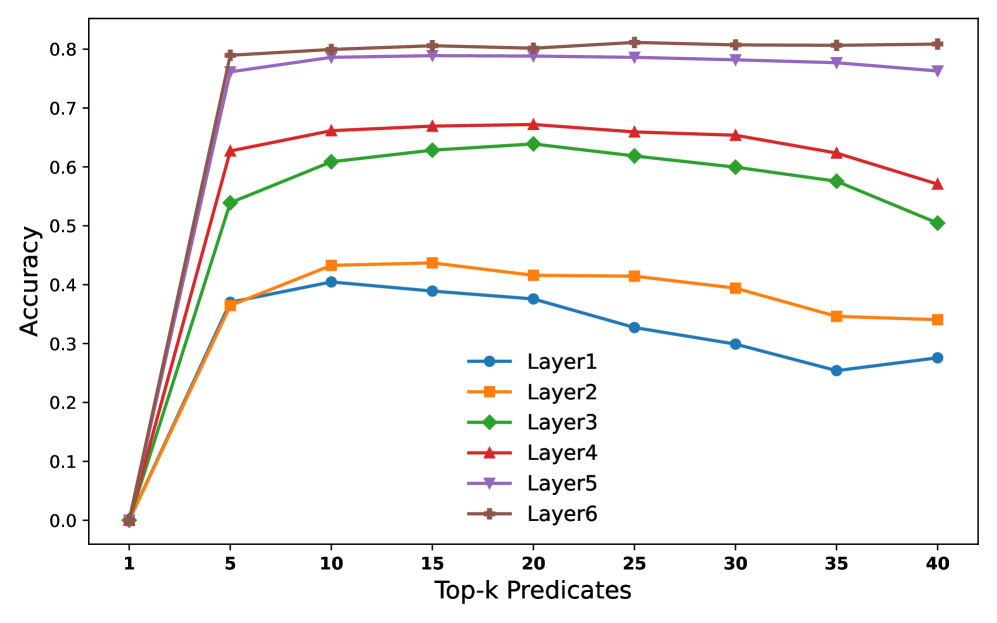
This image presents a line chart illustrating the relationship between "Accuracy" and "Top-k Predicates" for six different layers (Layer1 through Layer6). The chart displays how accuracy changes as the number of top-k predicates considered increases from 1 to 40.
### Components/Axes
* **X-axis:** "Top-k Predicates" - Scale ranges from 1 to 40, with markers at 1, 5, 10, 15, 20, 25, 30, 35, and 40.
* **Y-axis:** "Accuracy" - Scale ranges from 0.0 to 0.8, with markers at 0.0, 0.1, 0.2, 0.3, 0.4, 0.5, 0.6, 0.7, and 0.8.
* **Legend:** Located in the top-right corner of the chart. It identifies each line with a corresponding color and layer name:
* Layer1 (Blue) - Circle Marker
* Layer2 (Orange) - Square Marker
* Layer3 (Green) - Triangle Marker
* Layer4 (Red) - Diamond Marker
* Layer5 (Purple) - Star Marker
* Layer6 (Brown) - Cross Marker
### Detailed Analysis
Here's a breakdown of each layer's accuracy trend and approximate data points:
* **Layer1 (Blue):** The line starts at approximately 0.35 at Top-k = 1. It decreases to around 0.30 at Top-k = 5, then fluctuates around 0.32-0.35 until Top-k = 40.
* **Layer2 (Orange):** The line begins at approximately 0.75 at Top-k = 1. It decreases slightly to around 0.68 at Top-k = 5, then remains relatively stable between 0.65 and 0.70 until Top-k = 40.
* **Layer3 (Green):** The line starts at approximately 0.58 at Top-k = 1. It increases to around 0.62 at Top-k = 5, then decreases to approximately 0.55 at Top-k = 40.
* **Layer4 (Red):** The line begins at approximately 0.68 at Top-k = 1. It increases to around 0.72 at Top-k = 5, then remains relatively stable between 0.70 and 0.75 until Top-k = 40.
* **Layer5 (Purple):** The line starts at approximately 0.78 at Top-k = 1. It remains very stable, fluctuating slightly between 0.77 and 0.80 throughout the entire range of Top-k values.
* **Layer6 (Brown):** The line begins at approximately 0.76 at Top-k = 1. It remains relatively stable, fluctuating slightly between 0.75 and 0.79 throughout the entire range of Top-k values.
### Key Observations
* Layer5 and Layer6 consistently exhibit the highest accuracy across all Top-k values.
* Layer1 demonstrates the lowest and most fluctuating accuracy.
* The accuracy of most layers initially increases or remains stable as Top-k increases from 1 to 5, suggesting that considering more predicates initially improves performance.
* Beyond Top-k = 5, the accuracy of most layers plateaus or slightly decreases, indicating diminishing returns from considering an increasing number of predicates.
* Layer 2 and Layer 4 show similar trends, with a slight initial decrease followed by stability.
### Interpretation
The chart suggests that the performance of these layers is sensitive to the number of top-k predicates considered. Layers 5 and 6 are the most robust, maintaining high accuracy regardless of the number of predicates. Layer 1 is the least reliable, with its accuracy remaining low and fluctuating. The initial improvement in accuracy as Top-k increases from 1 to 5 could be due to the model gaining access to more relevant information. However, the plateau or slight decrease in accuracy beyond Top-k = 5 suggests that adding more predicates introduces noise or irrelevant information that degrades performance. This could indicate that the optimal number of predicates to consider is around 5 for these layers. The differences in performance between layers could be attributed to variations in their architecture, training data, or hyperparameters. Further investigation would be needed to determine the specific factors contributing to these differences.