## Line Chart: Accuracy vs. Top-k Predicates for Different Layers
### Overview
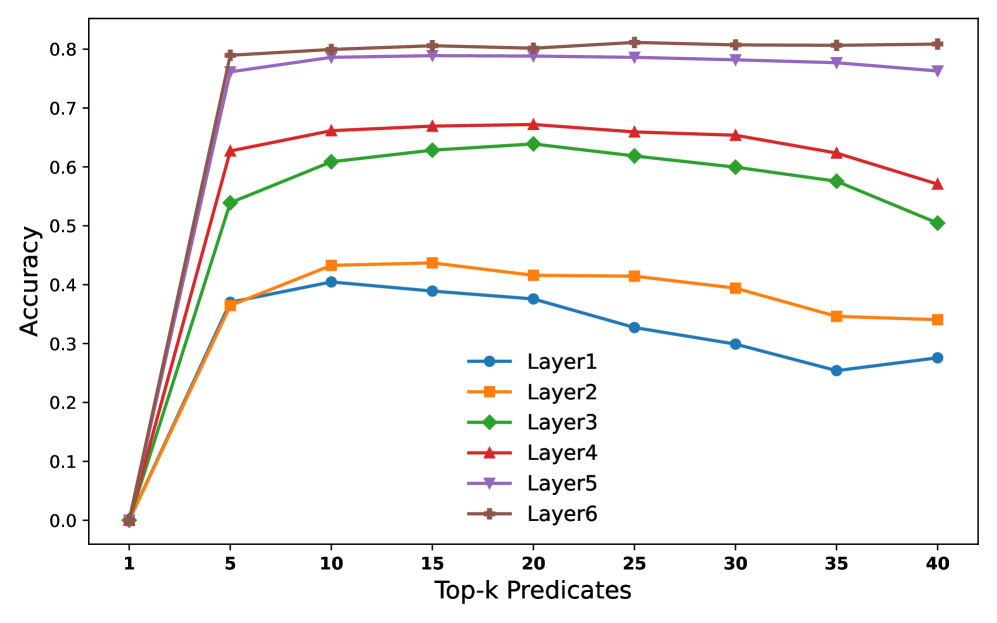
This is a line chart plotting the accuracy of six different model layers (Layer1 through Layer6) as a function of the number of top-k predicates considered. The chart demonstrates how predictive accuracy changes for each layer as more predicates are included, showing distinct performance tiers and trends.
### Components/Axes
* **X-Axis:** Labeled **"Top-k Predicates"**. It has discrete markers at values: 1, 5, 10, 15, 20, 25, 30, 35, 40.
* **Y-Axis:** Labeled **"Accuracy"**. It is a linear scale ranging from 0.0 to 0.8, with major tick marks at every 0.1 interval.
* **Legend:** Positioned in the **bottom-right quadrant** of the chart area. It contains six entries, each with a unique color and marker symbol:
* Layer1: Blue line with circle markers (●)
* Layer2: Orange line with square markers (■)
* Layer3: Green line with diamond markers (◆)
* Layer4: Red line with upward-pointing triangle markers (▲)
* Layer5: Purple line with downward-pointing triangle markers (▼)
* Layer6: Brown line with plus/cross markers (+)
### Detailed Analysis
All six data series originate at the same point: **(Top-k=1, Accuracy=0.0)**. From there, they exhibit a sharp increase in accuracy up to **Top-k=5**, followed by a plateau or gradual change.
**Trend Verification & Approximate Data Points:**
* **Layer6 (Brown, +):** Shows the highest overall accuracy. It rises sharply to ~0.79 at k=5, peaks at ~0.81 around k=25, and remains nearly flat, ending at ~0.81 at k=40. **Trend:** Rapid ascent to a high, stable plateau.
* **Layer5 (Purple, ▼):** Follows a very similar path to Layer6 but is consistently slightly lower. It reaches ~0.76 at k=5, peaks at ~0.79 around k=15, and shows a very slight decline to ~0.76 at k=40. **Trend:** Rapid ascent to a high plateau with minimal decay.
* **Layer4 (Red, ▲):** Occupies the next tier. It jumps to ~0.63 at k=5, peaks at ~0.67 around k=20, and then gradually declines to ~0.57 at k=40. **Trend:** Rapid ascent, a moderate peak, followed by a steady decline.
* **Layer3 (Green, ◆):** Rises to ~0.54 at k=5, peaks at ~0.64 around k=20, and declines to ~0.51 at k=40. **Trend:** Similar shape to Layer4 but at a lower accuracy level.
* **Layer2 (Orange, ■):** Increases to ~0.37 at k=5, peaks at ~0.44 around k=15, and then declines to ~0.34 at k=40. **Trend:** Moderate ascent, an early peak, and a steady decline.
* **Layer1 (Blue, ●):** Shows the lowest performance. It rises to ~0.37 at k=5, peaks at ~0.41 around k=10, and then declines more noticeably to ~0.28 at k=40. **Trend:** Moderate ascent, the earliest peak among all layers, and the most pronounced decline.
### Key Observations
1. **Performance Hierarchy:** There is a clear and consistent stratification. From highest to lowest accuracy: Layer6 ≈ Layer5 > Layer4 > Layer3 > Layer2 > Layer1.
2. **Peak Location:** The Top-k value at which peak accuracy occurs varies by layer. Lower layers (Layer1, Layer2) peak earlier (k=10-15), while higher layers (Layer4, Layer5, Layer6) peak later (k=15-25).
3. **Post-Peak Behavior:** After reaching their peak, the accuracy of lower layers (Layer1, Layer2, Layer3) degrades more significantly as k increases towards 40. The highest layers (Layer5, Layer6) are remarkably stable, showing almost no degradation.
4. **Initial Convergence:** All layers start at 0% accuracy with only 1 predicate and experience their most dramatic performance gain between k=1 and k=5.
### Interpretation
The data suggests a fundamental relationship between model depth (layer hierarchy) and the utilization of predicate information for accuracy.
* **Layer Specialization:** Higher layers (5 and 6) are not only more accurate but also more robust. They can effectively leverage a larger set of top predicates (up to 40) without performance loss, indicating they may be integrating more complex, high-level features that remain relevant even as the candidate pool grows.
* **Noise Sensitivity in Lower Layers:** The declining accuracy in lower layers (1, 2, 3) after a relatively early peak suggests they are more sensitive to noise. Adding more predicates beyond an optimal point (k=10-20) likely introduces irrelevant or conflicting signals that these less sophisticated layers cannot filter out, leading to performance degradation.
* **Practical Implication:** For tasks relying on these layers, there is a clear trade-off. Using a higher layer provides better and more stable accuracy. If a lower layer must be used, the number of predicates (k) must be carefully tuned to its specific peak to avoid the detrimental effects of over-inclusion. The chart provides the empirical data needed to make that tuning decision for each layer.