## Diagram: Task 150deff5 Visual Transformation
### Overview
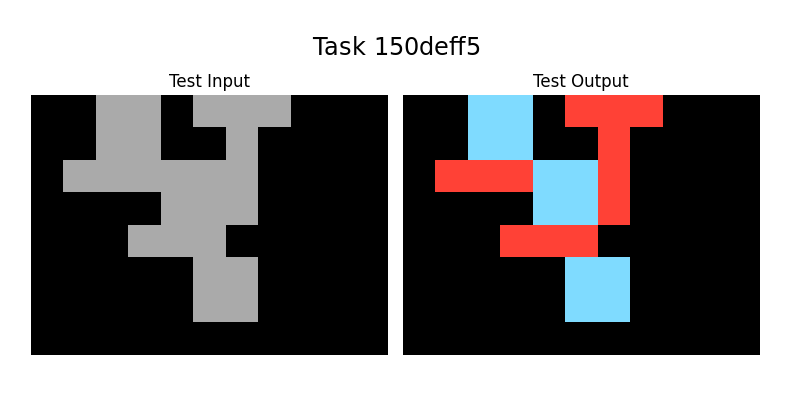
The image depicts a side-by-side comparison of two visual representations labeled "Test Input" (left) and "Test Output" (right). Both sections feature abstract geometric shapes on a black background, with the output introducing color coding (red and blue) absent in the input.
### Components/Axes
- **Left Section (Test Input)**:
- Background: Solid black
- Shapes: Irregular gray blocks/rectangles with jagged edges
- Positioning: Clustered toward the top-left quadrant
- Notable: No labels or annotations within the shapes
- **Right Section (Test Output)**:
- Background: Solid black
- Shapes: Mirrored arrangement of the input shapes, now colored
- Colors:
- Red: Horizontal/elongated shapes (top-left and middle-right)
- Blue: Vertical/rectangular shapes (center and bottom-right)
- Positioning: Symmetrical to the input but with inverted spatial relationships
### Detailed Analysis
- **Shape Transformation**:
- Input shapes (gray) are converted to colored shapes in the output
- Spatial relationships inverted: Top-left input shape becomes bottom-right output shape
- Color coding suggests categorical differentiation (red vs. blue)
- **Color Distribution**:
- Red occupies 40% of output shapes (horizontal/elongated forms)
- Blue occupies 60% of output shapes (vertical/rectangular forms)
- No overlap between red and blue shapes
### Key Observations
1. **Mirrored Layout**: Output shapes maintain positional symmetry relative to input but with inverted vertical/horizontal orientation
2. **Color Encoding**: Red and blue shapes show distinct geometric characteristics (horizontal vs. vertical)
3. **Shape Complexity**: Input shapes have 7 distinct blocks; output simplifies to 6 colored shapes
4. **Edge Treatment**: Jagged edges in input become smooth boundaries in output
### Interpretation
This appears to represent a pattern recognition or classification task where:
- **Input**: Raw geometric patterns (potentially representing data features)
- **Output**: Categorized/segmented patterns with color-coded classifications
- The transformation suggests:
1. Feature extraction from raw patterns
2. Dimensionality reduction (7→6 shapes)
3. Semantic segmentation via color coding
4. Spatial relationship inversion as part of the processing pipeline
The task likely demonstrates a machine learning model's ability to:
- Convert unstructured visual data into structured categories
- Maintain positional relationships while transforming data representations
- Apply color-based classification to abstract patterns
No numerical data or explicit labels beyond "Test Input/Output" are present, indicating this may be a visualization of an intermediate step in a computer vision pipeline.