## Flow Simulation Comparison
### Overview
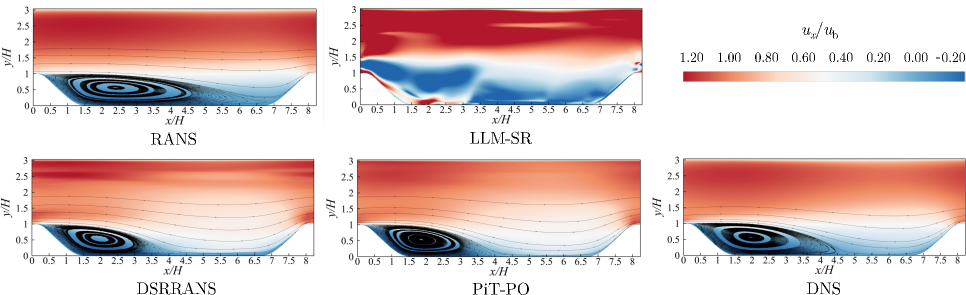
The image presents a comparison of flow simulations using different computational models: RANS, LLM-SR, DSRRANS, PiT-PO, and DNS. Each simulation visualizes the flow field over a backward-facing step, displaying the velocity component *u_x / u_b* as a color gradient and streamlines to indicate flow direction.
### Components/Axes
* **Title:** The title is not explicitly stated in the image, but the sub-titles of each subplot indicate the simulation method used.
* **X-axis:** *x/H*, ranging from 0 to 8. This represents the normalized horizontal distance.
* **Y-axis:** *y/H*, ranging from 0 to 3. This represents the normalized vertical distance.
* **Colorbar:** Located at the top-right, indicating the velocity component *u_x / u_b*. Red corresponds to positive values (1.20 to 0.40), white corresponds to 0.00, and blue corresponds to negative values (-0.20).
* **Streamlines:** Black lines indicating the direction of flow.
### Detailed Analysis
Each subplot represents a different simulation method:
1. **RANS (Reynolds-Averaged Navier-Stokes):**
* A large recirculation zone is visible behind the step (x/H ≈ 1 to 4, y/H ≈ 0 to 1).
* The flow reattaches around x/H ≈ 6.
* The color gradient shows a relatively smooth transition from negative (blue) to positive (red) velocities.
2. **LLM-SR (Likely Large-eddy Simulation - Spectral Relaxation):**
* The recirculation zone is less defined compared to RANS.
* Significant regions of negative velocity (blue) extend further upwards (y/H ≈ 1.5) and downstream.
* The color gradient shows more turbulent structures.
3. **DSRRANS (Detached Eddy Simulation RANS):**
* The recirculation zone is similar to RANS but slightly smaller.
* The flow reattaches around x/H ≈ 6.
* The color gradient is smoother than LLM-SR but shows some turbulent features.
4. **PiT-PO (Perturbation-Informed Training - Physics-Only):**
* The recirculation zone is similar in size and shape to RANS and DSRRANS.
* The flow reattaches around x/H ≈ 6.
* The color gradient is relatively smooth.
5. **DNS (Direct Numerical Simulation):**
* The recirculation zone is similar to RANS, DSRRANS, and PiT-PO.
* The flow reattaches around x/H ≈ 6.
* The color gradient is relatively smooth.
### Key Observations
* **Recirculation Zone:** All simulations show a recirculation zone behind the step, but the size and intensity vary. LLM-SR shows a more extended region of negative velocity.
* **Flow Reattachment:** The flow reattaches at approximately the same location (x/H ≈ 6) in RANS, DSRRANS, PiT-PO, and DNS.
* **Turbulence:** LLM-SR exhibits more turbulent structures in the color gradient compared to the other methods.
### Interpretation
The image compares the performance of different turbulence models in simulating flow over a backward-facing step. RANS, DSRRANS, PiT-PO, and DNS show qualitatively similar results, with a well-defined recirculation zone and flow reattachment at approximately the same location. LLM-SR, on the other hand, predicts a more extended region of negative velocity and exhibits more turbulent structures. This suggests that LLM-SR captures more of the unsteady flow features compared to the other models. The choice of turbulence model depends on the specific application and the desired level of accuracy. RANS models are computationally cheaper but may not accurately capture complex flow features, while DNS is the most accurate but also the most computationally expensive. LLM-SR and DSRRANS offer a compromise between accuracy and computational cost.