## Heatmap:Turbulence Model Velocity Profiles
### Overview
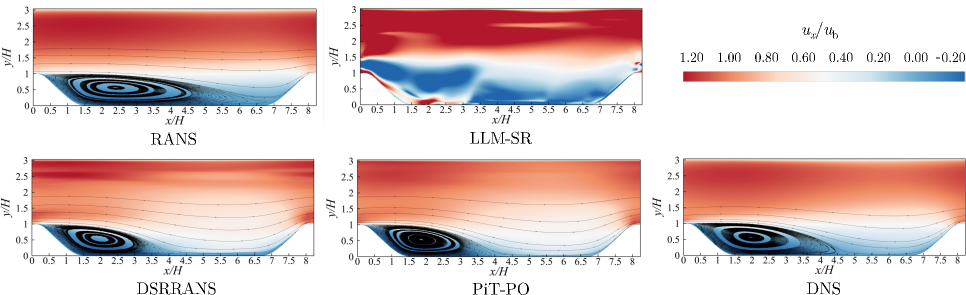
The image presents six comparative heatmaps visualizing velocity profiles (u_x/u_b) across normalized spatial coordinates (x/H, y/H) for different turbulence modeling approaches. Each heatmap represents a distinct computational method, with color gradients indicating velocity magnitude and direction relative to a reference velocity (u_b).
### Components/Axes
- **X-axis (x/H)**: Normalized horizontal position, ranging from 0.5 to 7.5.
- **Y-axis (y/H)**: Normalized vertical position, ranging from 0 to 3.
- **Color Bar (u_x/u_b)**:
- Scale: -0.20 (blue) to 1.20 (red), representing velocity ratios.
- Position: Right-aligned vertical bar.
- **Heatmap Labels**:
- Top row: RANS, LLM-SR.
- Bottom row: DSRRANS, PiT-PO, DNS.
- Note: A sixth heatmap is unlabeled in the provided image.
### Detailed Analysis
1. **RANS**:
- Dominant red hues in upper regions (y/H > 1.5), indicating high velocity.
- Central blue vortex near y/H = 0.5, suggesting localized flow reversal.
2. **LLM-SR**:
- Smooth gradient from red (top) to blue (bottom), with no distinct vortices.
- Velocity transitions appear more uniform compared to RANS.
3. **DSRRANS**:
- Similar to RANS but with a less pronounced vortex.
- Red regions extend slightly lower (y/H ≈ 1.0), indicating broader high-velocity zones.
4. **PiT-PO**:
- Clear vortex structure near y/H = 0.5, matching DNS in spatial resolution.
- Red-to-blue gradient is sharper, suggesting higher velocity contrast.
5. **DNS**:
- Most detailed flow features, including a well-defined vortex at y/H ≈ 0.5.
- Red regions dominate the upper half (y/H > 1.5), with precise velocity gradients.
### Key Observations
- **Vortex Presence**: DNS and PiT-PO exhibit distinct vortices, while RANS and LLM-SR show weaker or absent vortices.
- **Velocity Contrast**: DNS and PiT-PO display sharper red-to-blue transitions, indicating higher fidelity in capturing flow dynamics.
- **Model Fidelity**: DNS (ground truth) shows the most complex flow structure, while RANS and LLM-SR exhibit oversimplified gradients.
### Interpretation
The heatmaps demonstrate how turbulence modeling approaches approximate flow dynamics:
- **DNS** serves as the reference, capturing intricate vortex structures and precise velocity gradients.
- **PiT-PO** closely mimics DNS, suggesting it effectively resolves turbulent features.
- **RANS** and **LLM-SR** oversimplify flow behavior, likely due to turbulence modeling assumptions (e.g., Reynolds-averaged equations).
- **DSRRANS** bridges RANS and DNS, retaining some vortex details but with reduced accuracy.
The color bar confirms that red regions (u_x/u_b > 1.0) represent supercritical velocities, while blue regions (u_x/u_b < 0) indicate flow reversal. The absence of a sixth label in the image may indicate a missing model or a labeling error. These results highlight the trade-offs between computational cost and flow fidelity across turbulence modeling strategies.